


Data visualisation, WebGL, 2026
SG / JB 15-Minute City Explorer
An open street-network study of how far daily life is from home in Singapore and Johor Bahru. It routes 5.8 million people on foot along every mapped street and footpath, then tells the result as a scrolling story, a live explorer and a methods page.
- Role
- Solo: research, data pipeline, design and build, paired with Claude
- Timeline
- October 2026, ongoing
- Stack
- Python and numba pipeline, React, MapLibre, deck.gl
The problem
The "15-minute city" asks whether everyday needs are a short walk from home. Most answers draw circles: every shop within a kilometre counts. Circles cannot say how many people a gap affects, and they ignore the fence, highway or dead end between you and the shop.
Singapore and Johor Bahru make the question sharp. They are one region, with about 327,000 people a day crossing at Woodlands, but two urban models: planned public-housing towns around transit on one side, car-oriented estates linked by highways on the other. I wanted a reader to feel the difference between a circle and a walk.
Research
I framed five research questions before touching the map: what share of people reach all six everyday essentials on foot, where the gaps are, how much is street layout versus destinations versus the map itself, how robust the result is to the definitions a researcher could pick, and what future mobility could change.
Circles overstate access
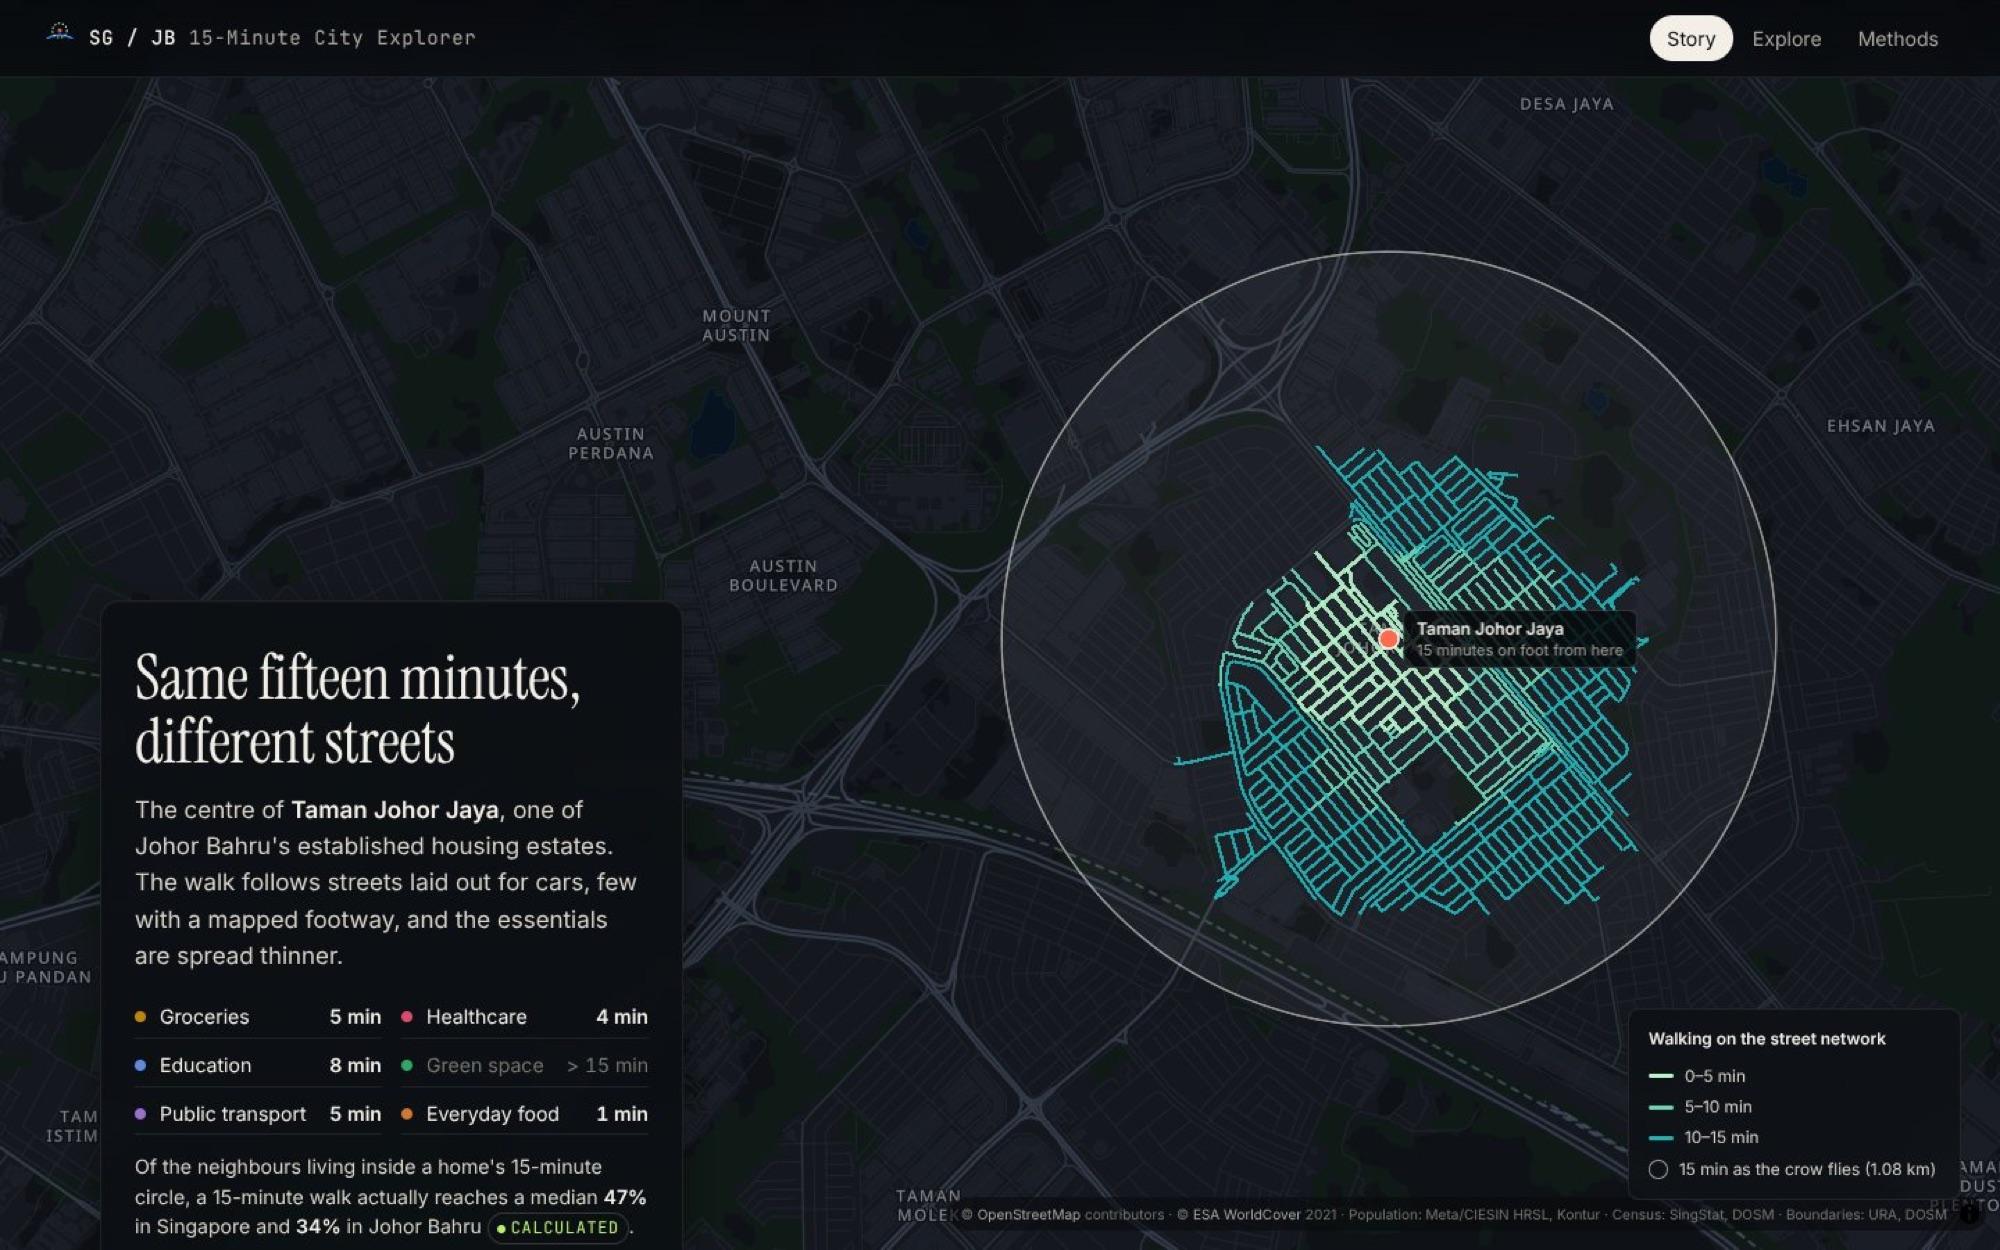
From a typical home, a 15-minute walk reaches a median 47% of the neighbours inside the 15-minute circle in Singapore, and 34% in Johor Bahru.
The map itself is uneven
OpenStreetMap lists far fewer clinics in Johor Bahru than a second source, Overture Places. That called for a cross-check, not a footnote.
Definitions can flip a finding
Walking speed, the time budget and which places count as essentials all move the numbers, so the study needed a sensitivity grid from the start.
Official portals were out of reach
Most government data portals could not be reached from the build environment, so every source came from an authoritative mirror and was recorded with its URL and checksum.
Design process
The design started from one sentence: a reader should feel the difference between a circle and a walk. That led to three surfaces built on the same data files, so every number on the site traces back to one pipeline run.
- 01
Pipeline
A walking graph of 456,015 nodes and 36,355 km of streets, 91,357 hexagon cells of census-calibrated residents, and one shortest-path search per essential. The whole access stage runs in about 75 seconds.
- 02
Story
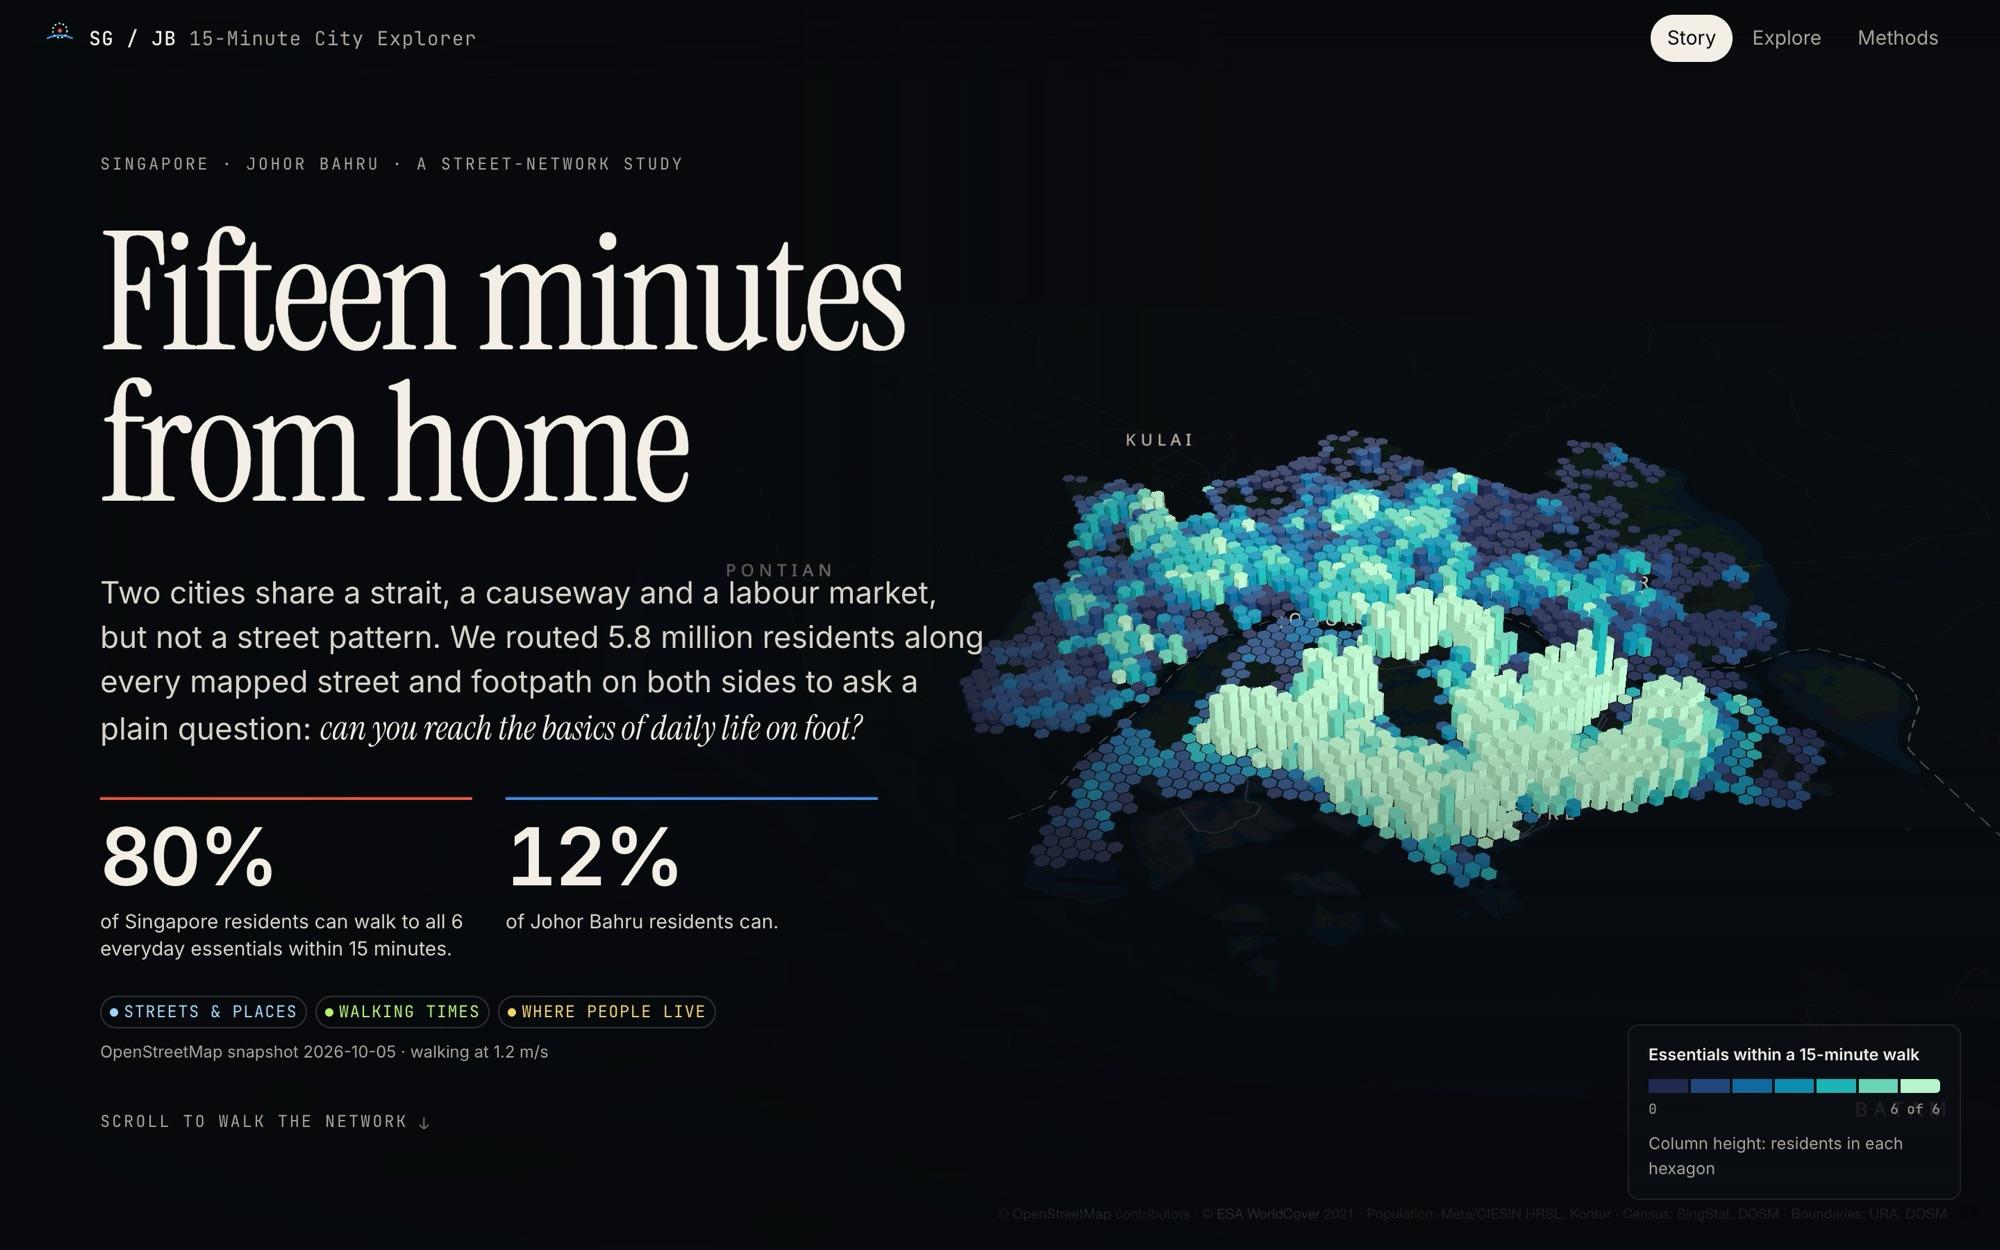
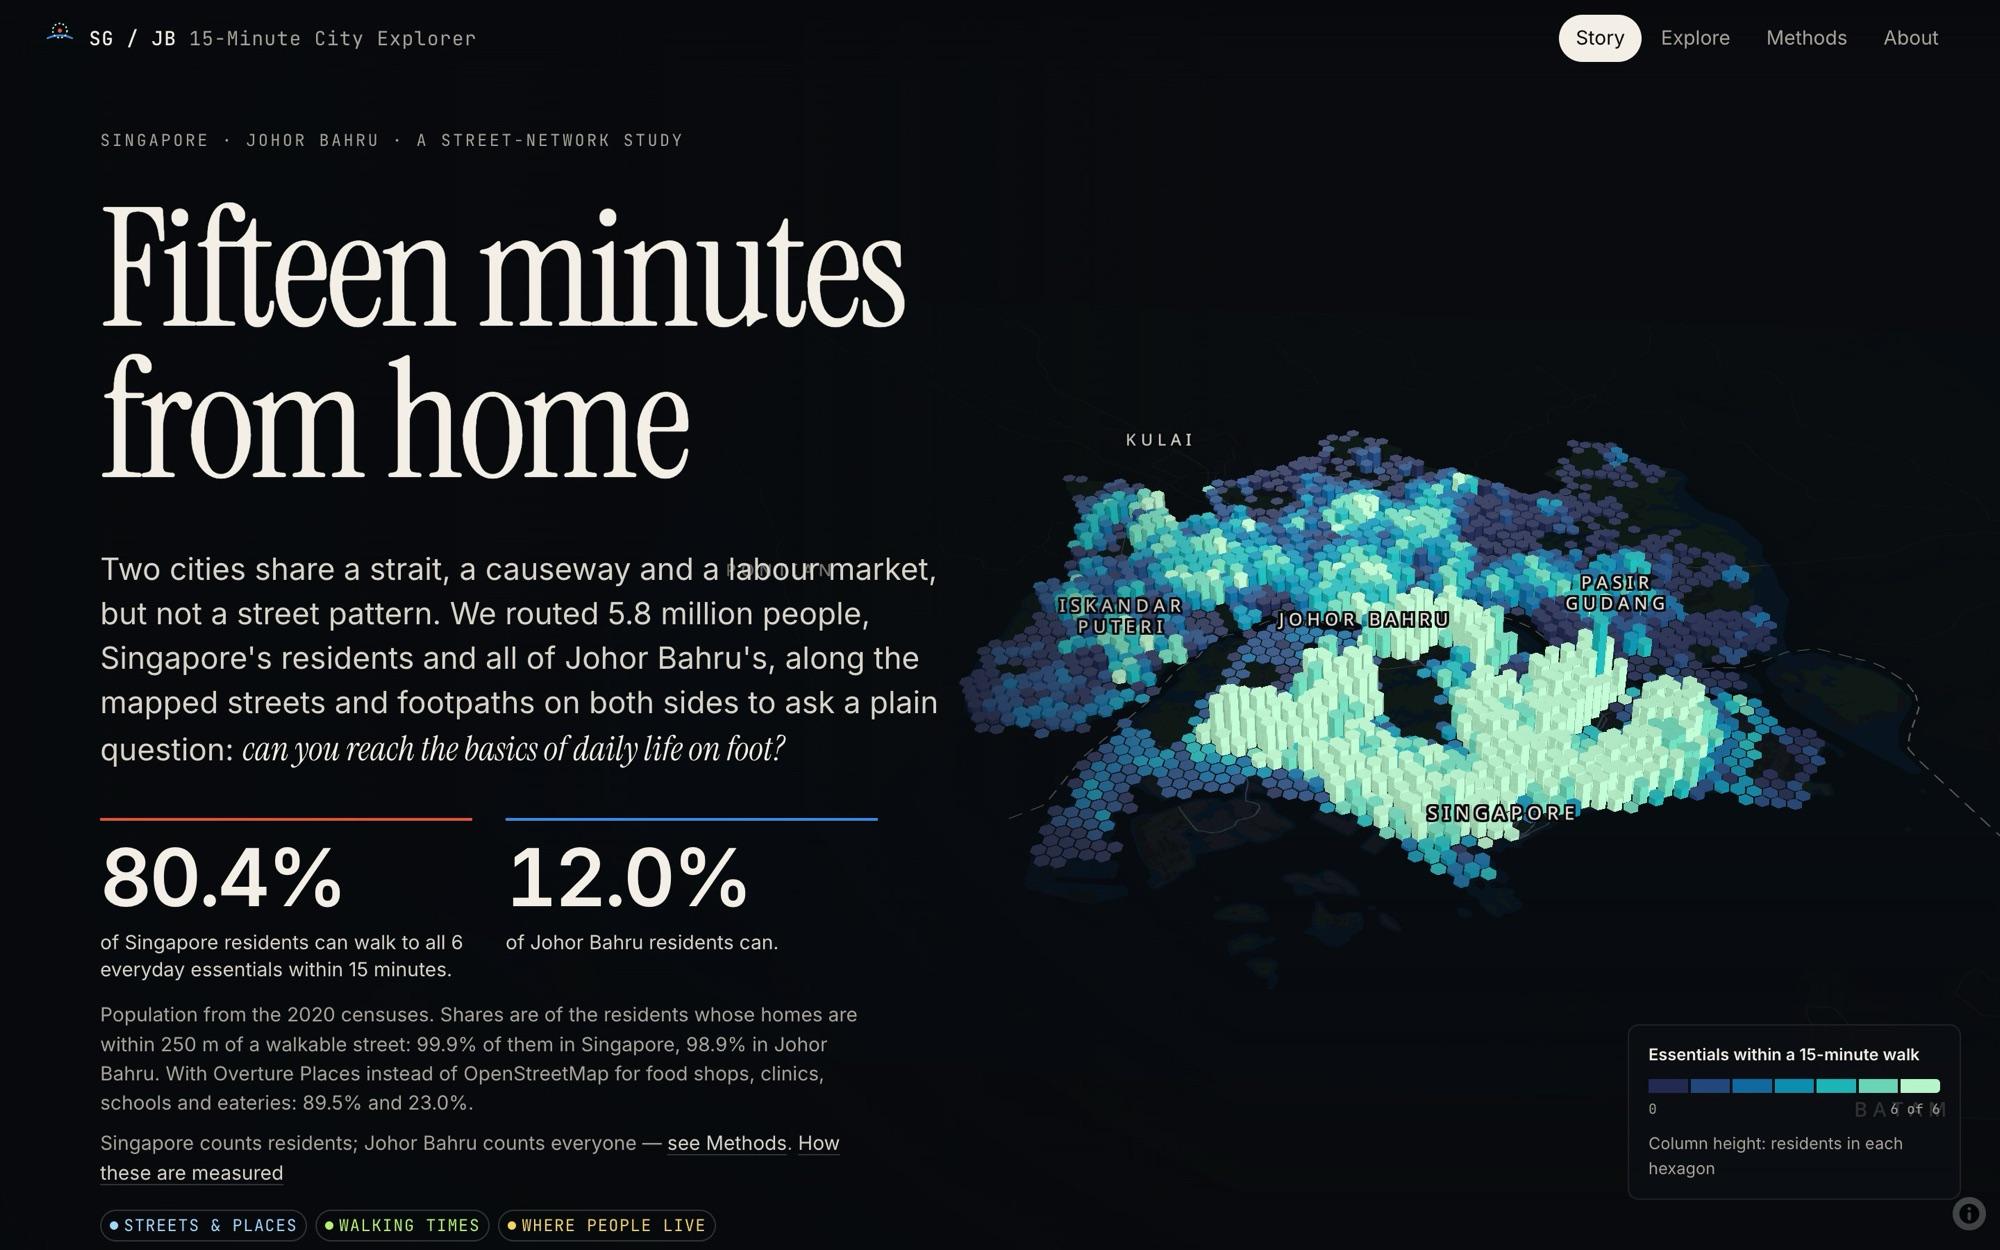
A scrollytelling essay over one fixed map. The hero shows both cities as hexagon columns, height for people and colour for essentials reached, so population and access read together.
- 03
Explorer
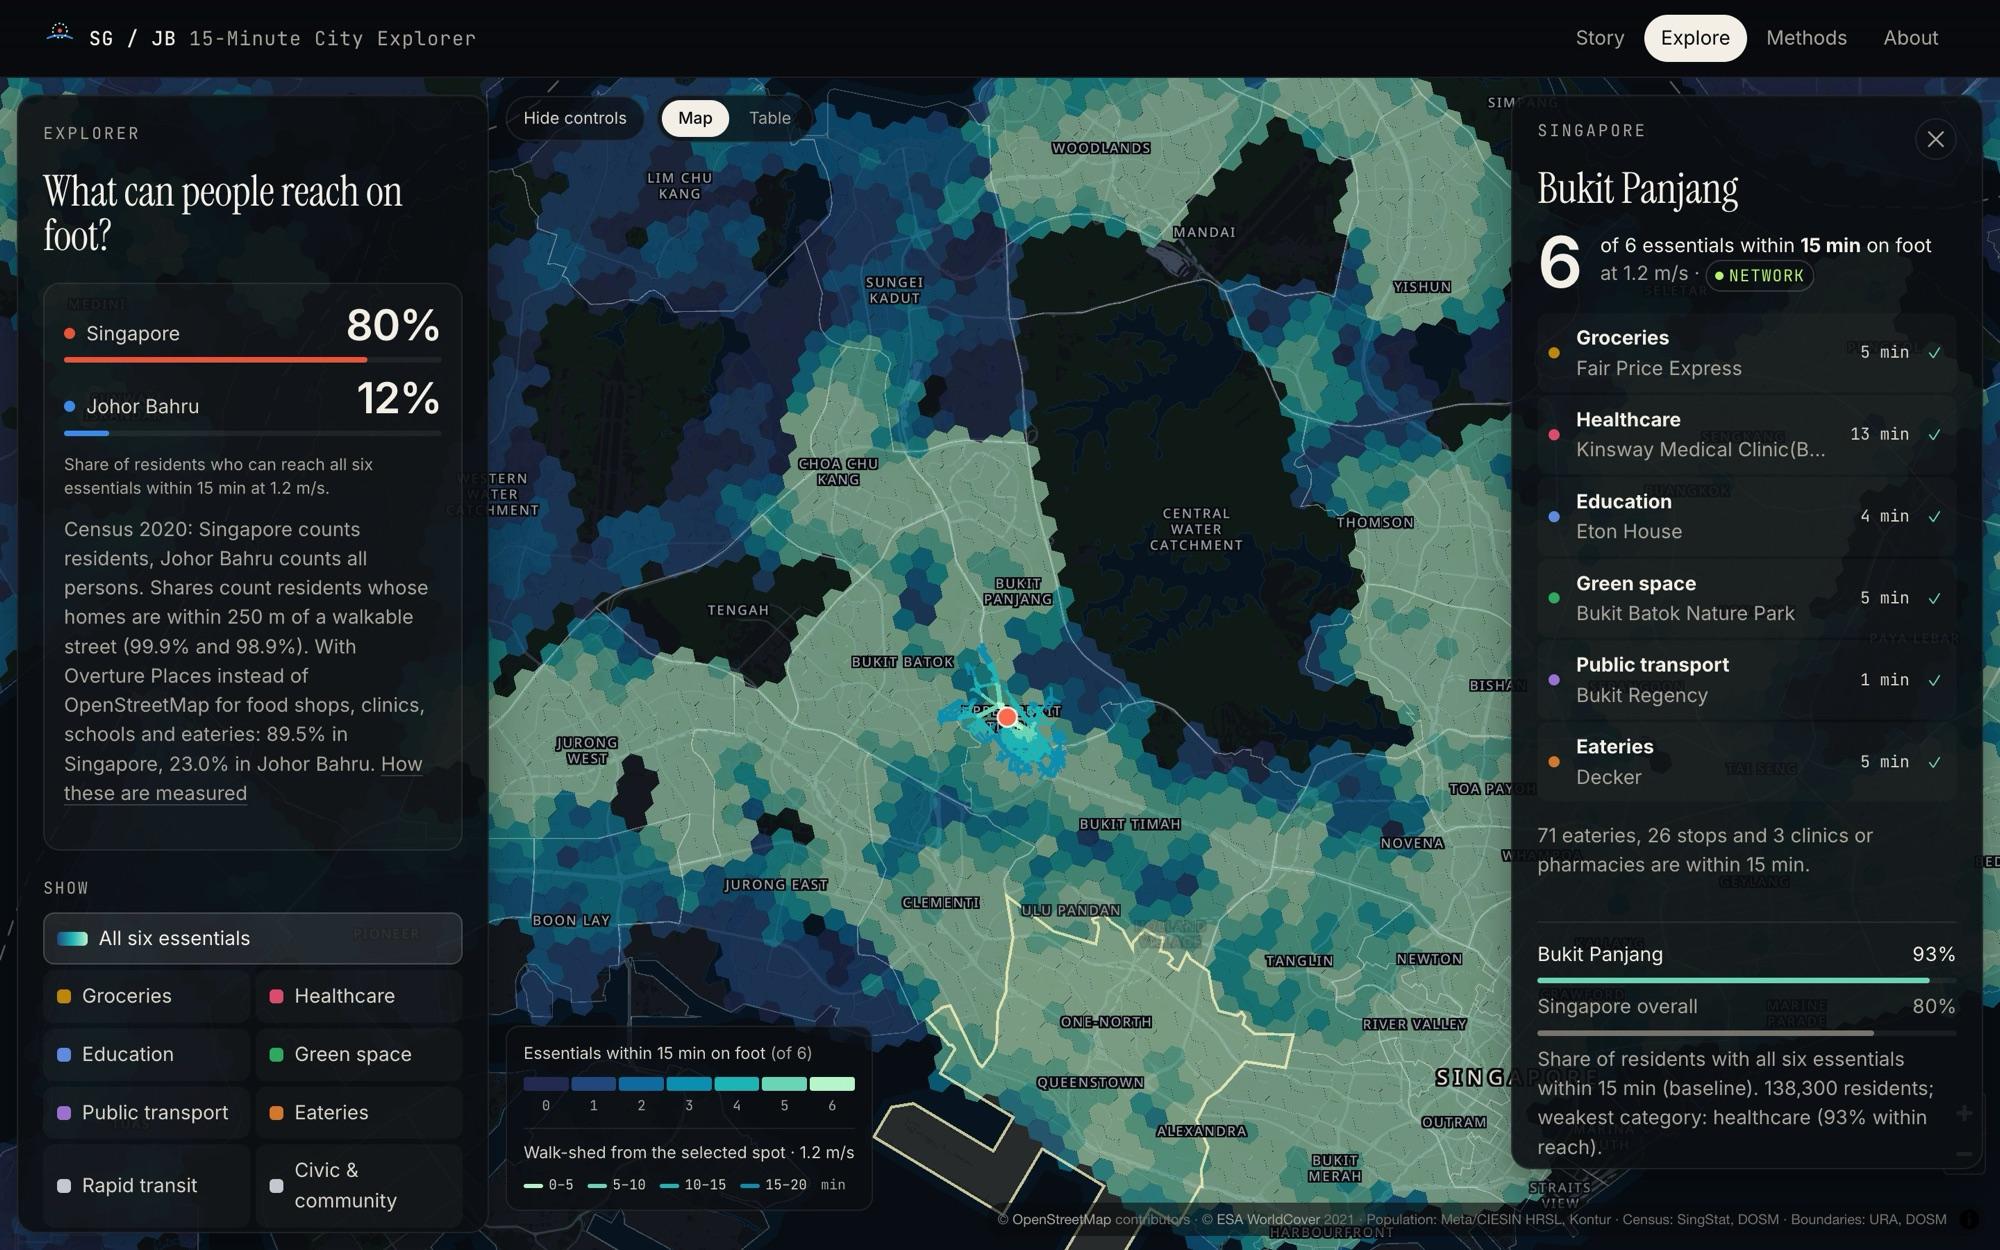
The full instrument: change the time budget, walking speed or definitions and every number recomputes in the browser. Click anywhere to watch a walk grow along the real streets.
- 04
Visual system
A dark night survey basemap so places with services light up, one blue to mint ramp checked for colour vision deficiency, and a badge on every number saying whether it is observed, calculated, modelled or a scenario.
Story scenes
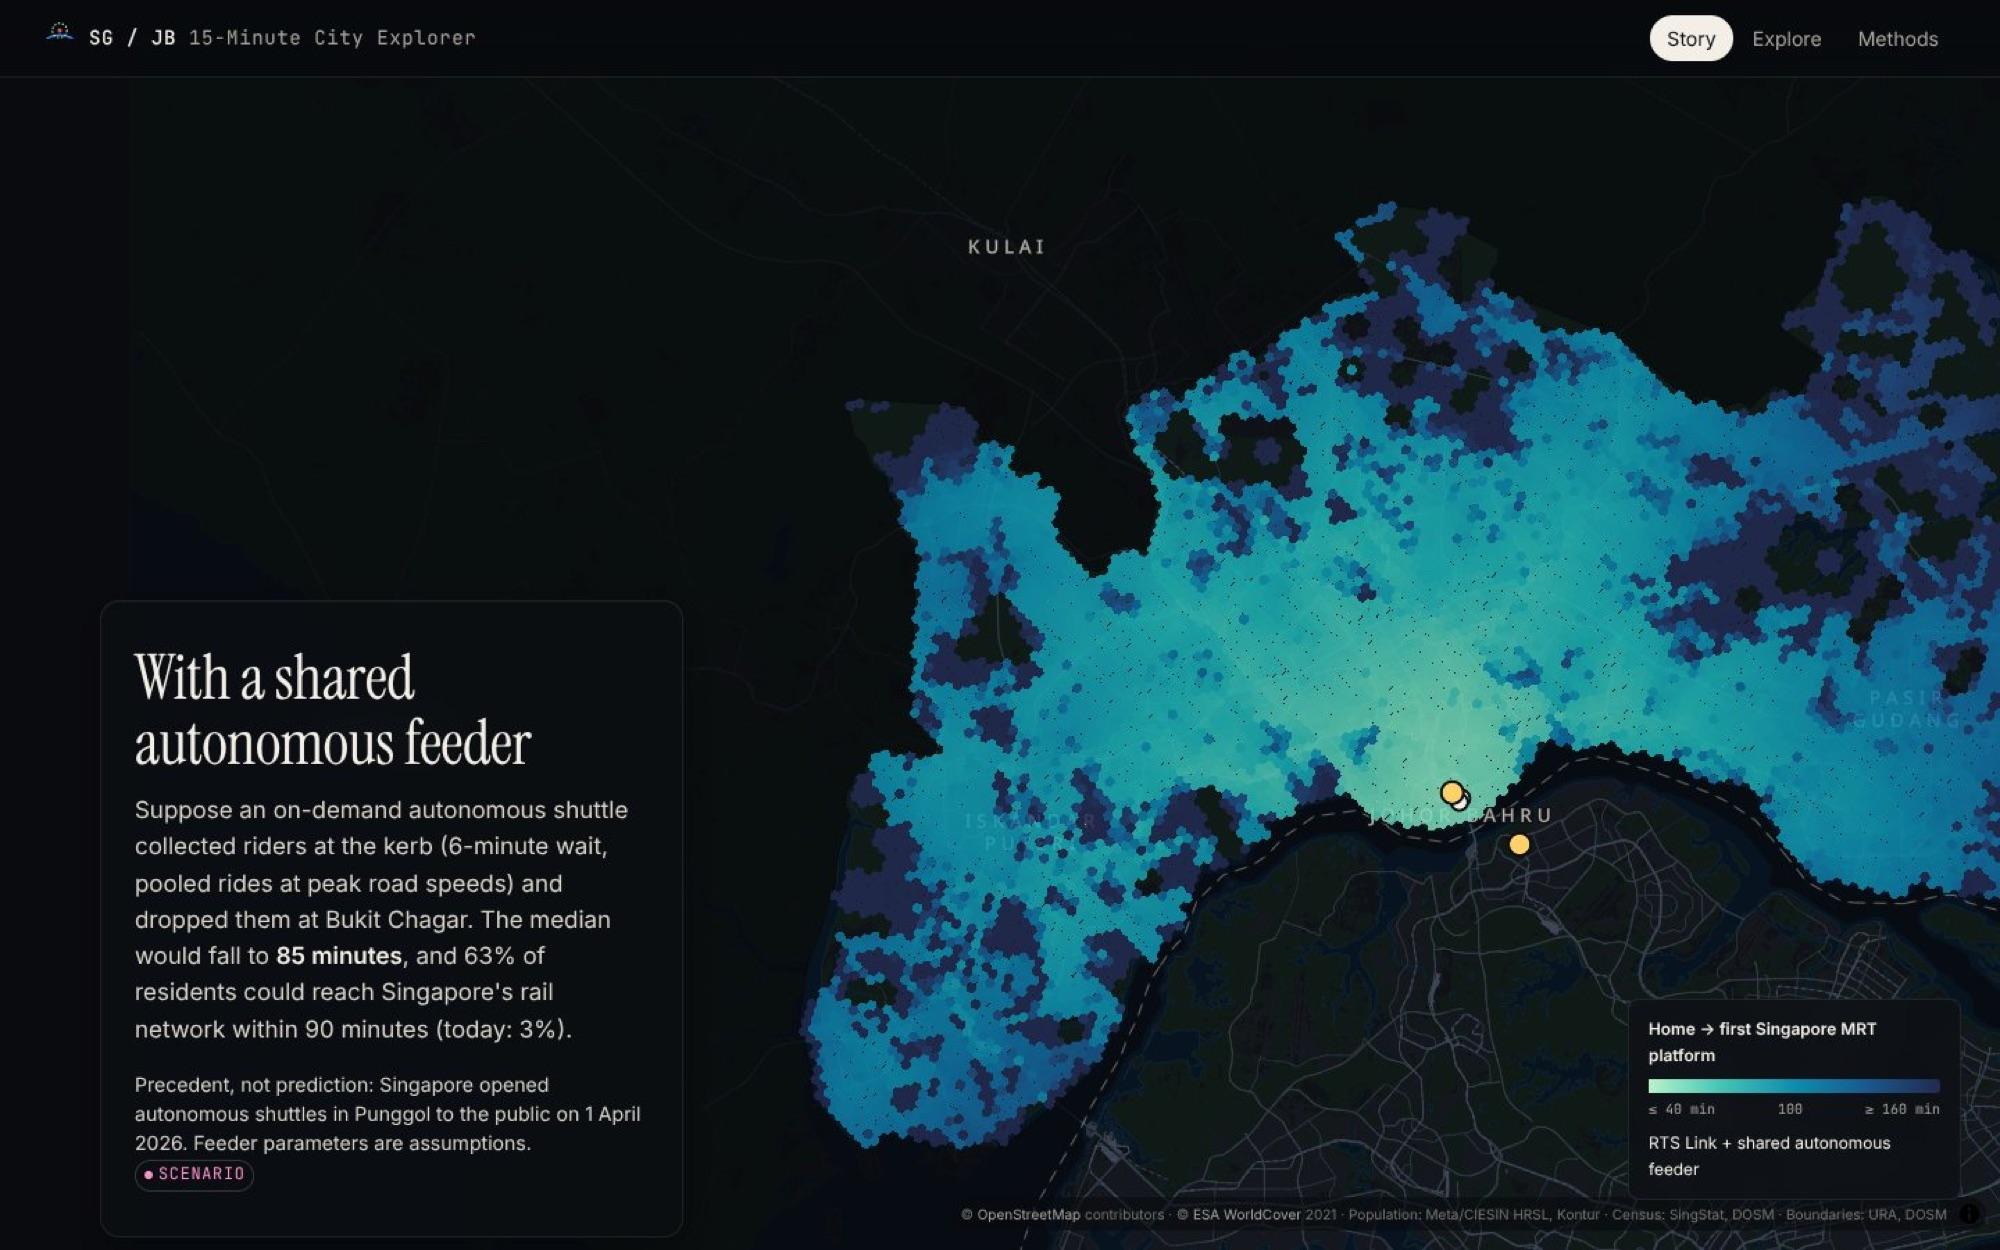
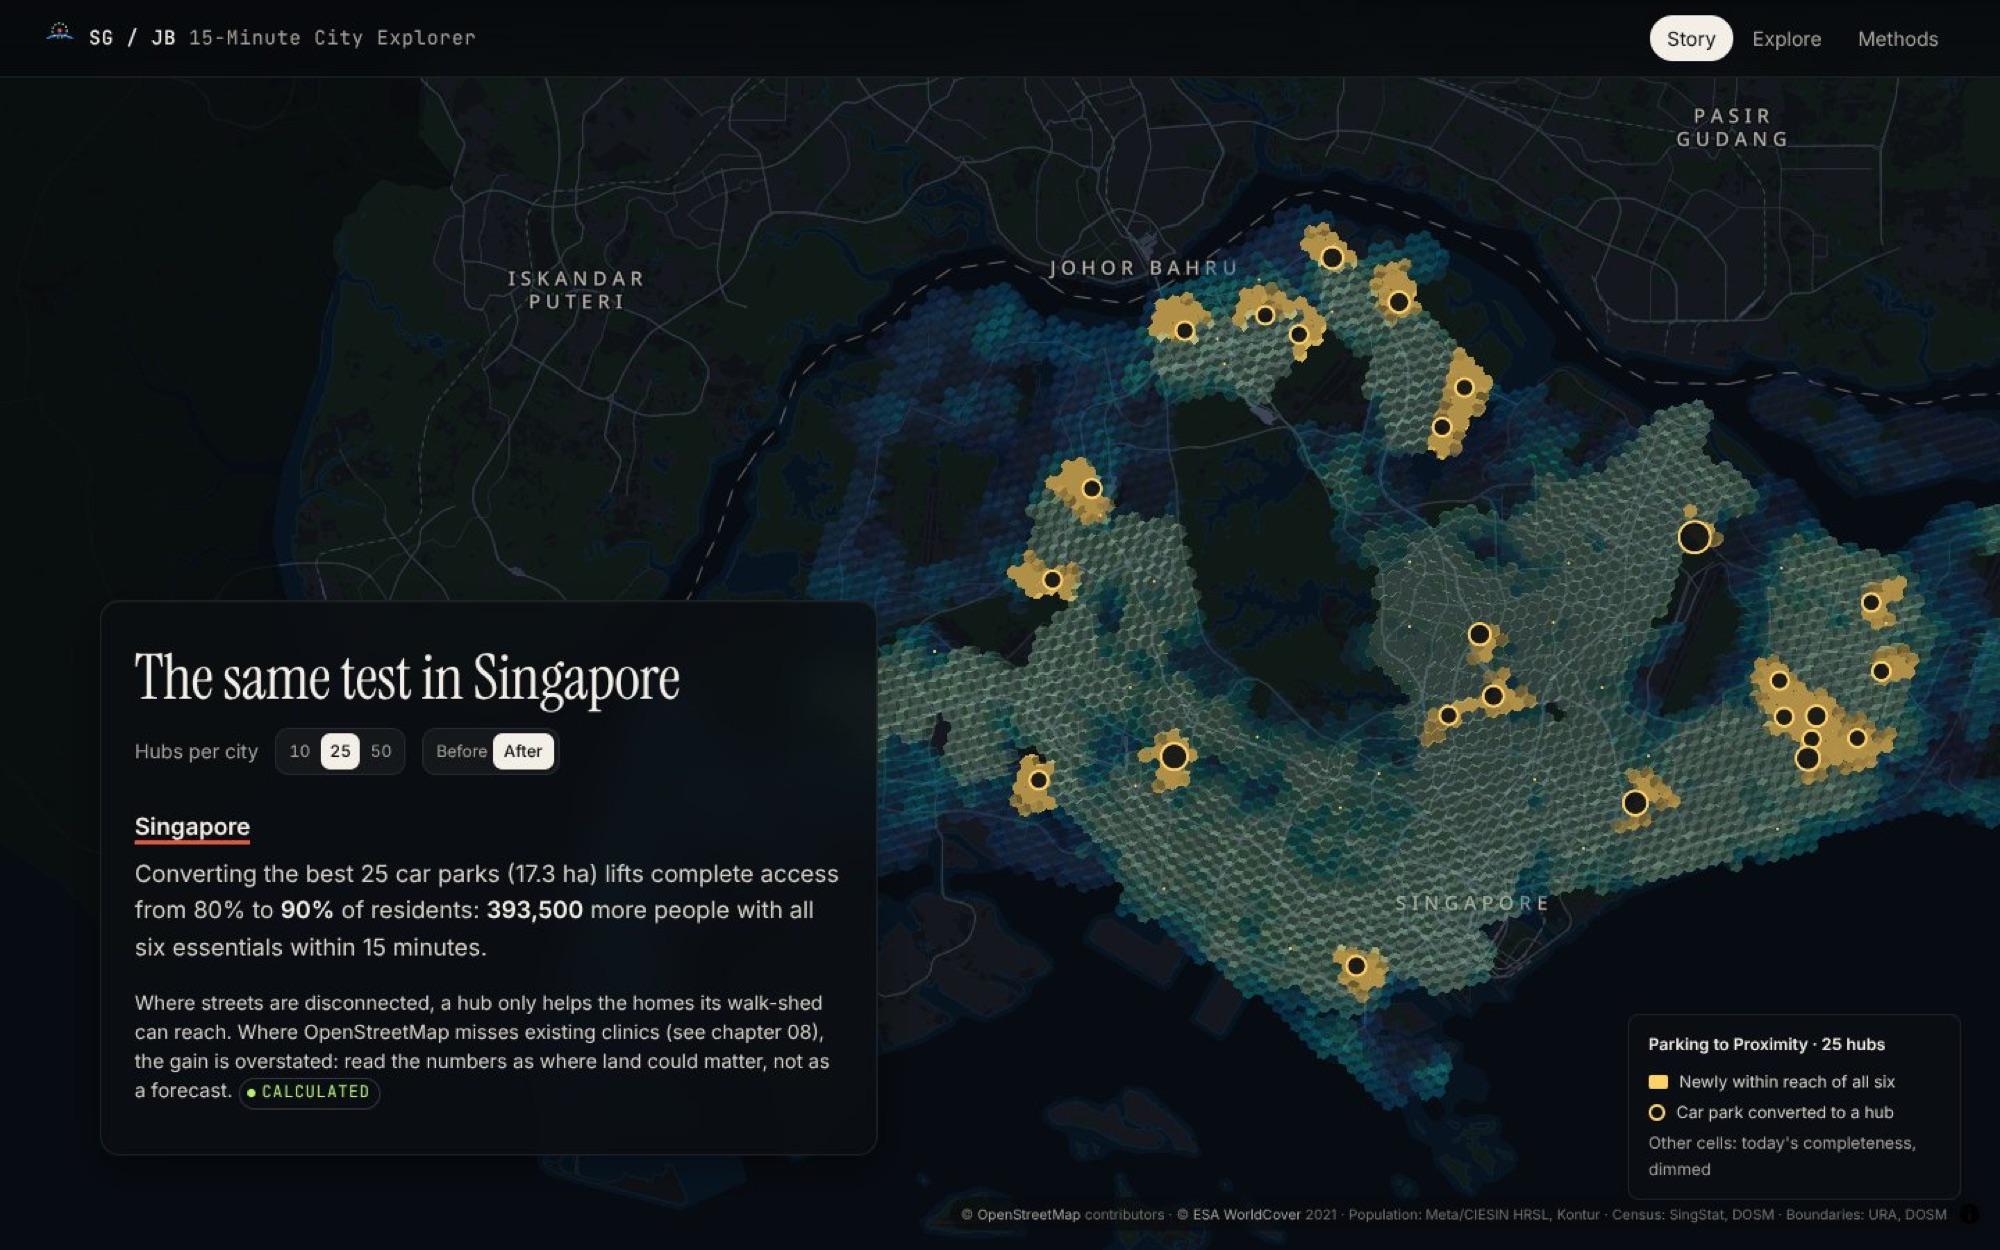
Each step of the story is a scene: a camera position, a set of map layers and a short essay. These are three of the scenes as they shipped.
Iterations
How SG / JB 15-Minute City Explorer changed on the way to what shipped, step by step.
v114 Oct
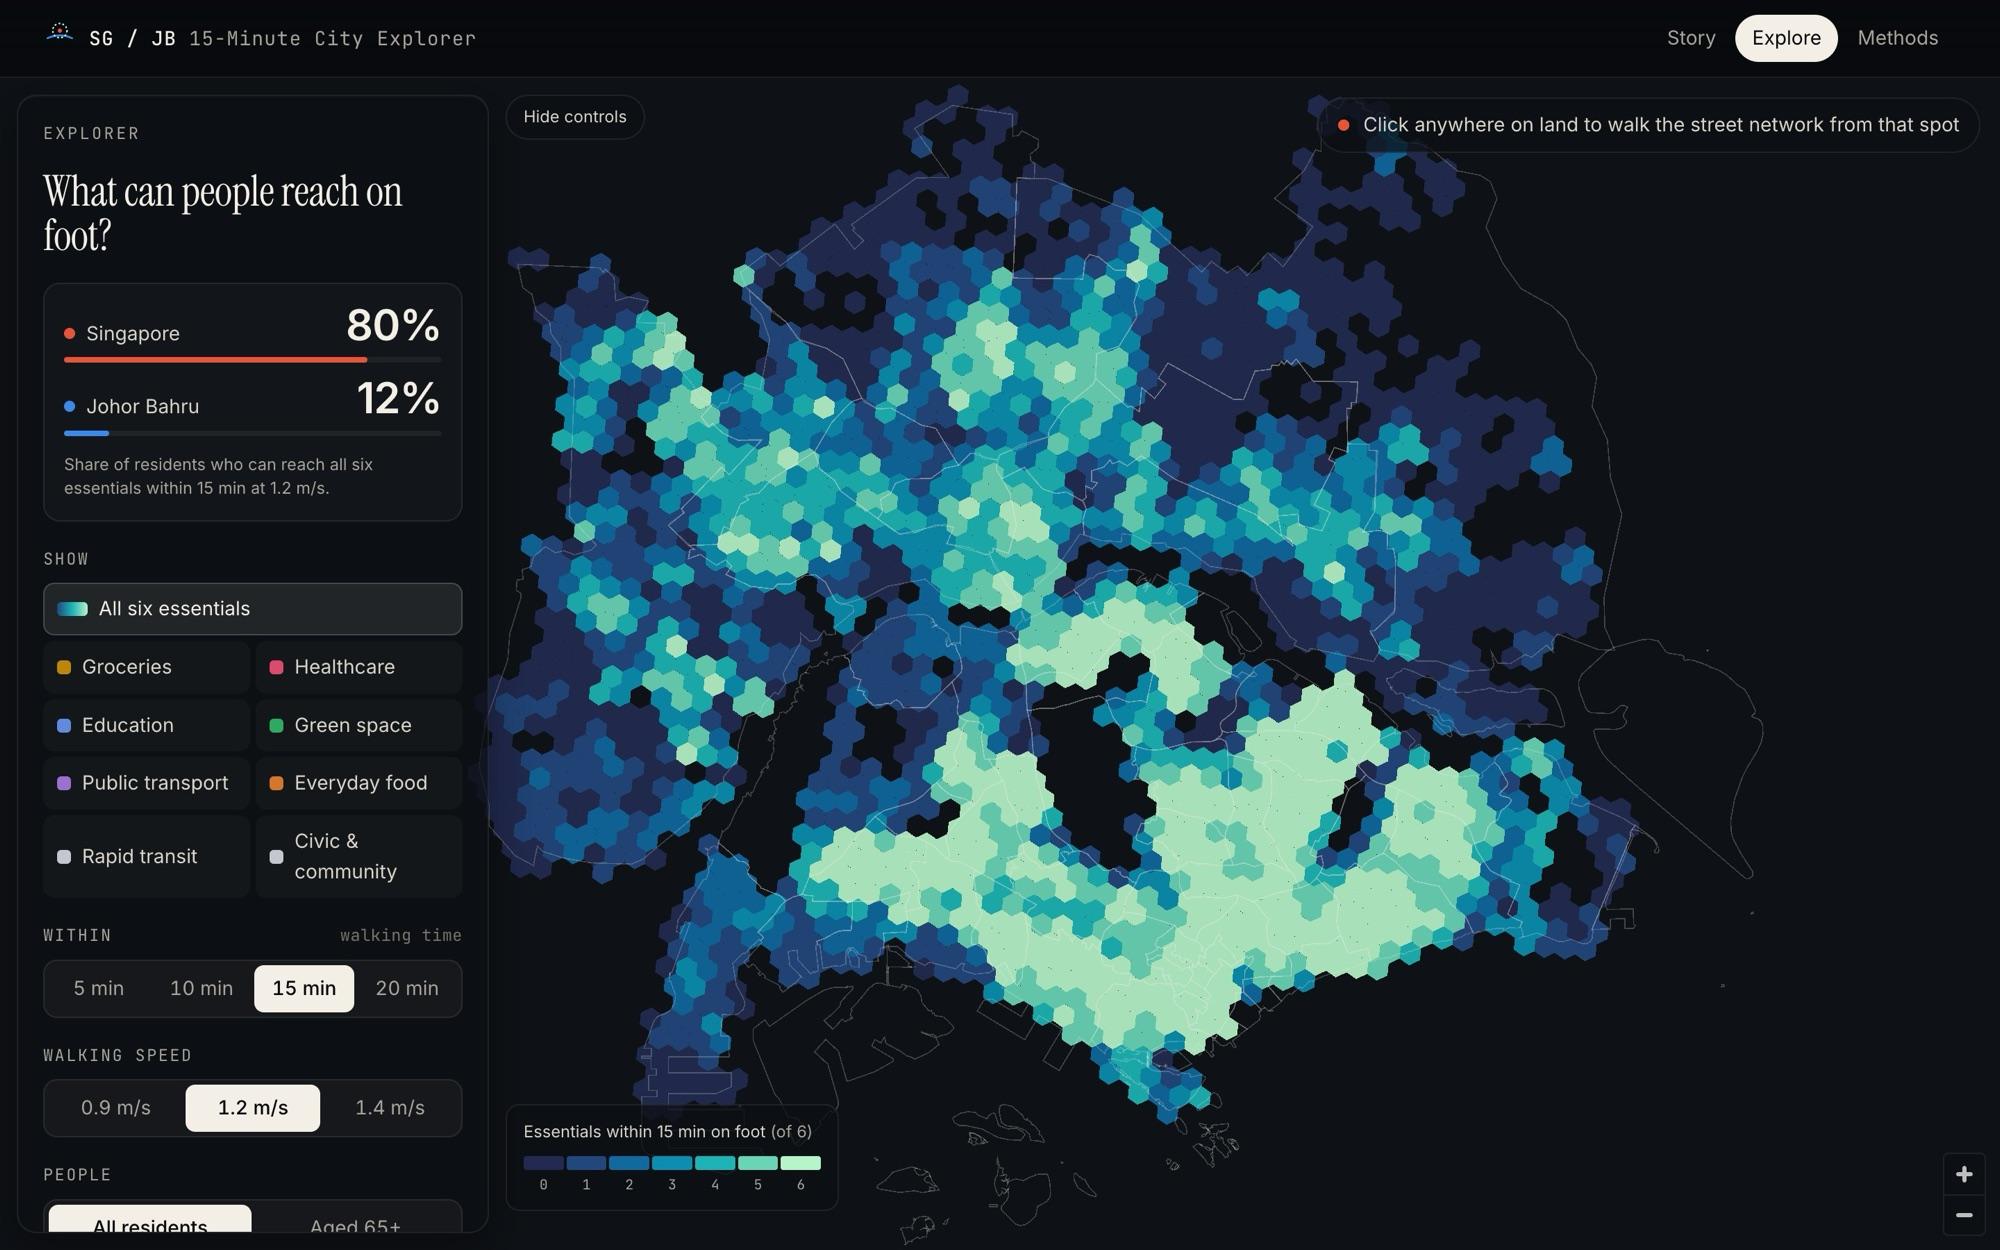
Explorer first
The first interface was the instrument itself: a flat hexagon map, filters for each essential, and walking time and speed controls. Powerful, but it asked the reader to know what to look for.
v214 Oct
A story on real data
A scrolling story moved in front of the explorer, with a 3D hexagon hero and one headline comparison: 80% against 12%. It now runs on the complete OpenStreetMap snapshot, not a development sample.
v314 Oct
Inspector and fallbacks
Clicking a place opens what a resident there can reach and how long each essential takes. A neighbourhood table and map stills keep every page usable for readers who cannot run the map.
v415 Oct
Qualified headlines
After a review round between ChatGPT and me, the headline gained a decimal and its caveats: census definitions differ, and a second places dataset gives 89.5% and 23.0%. Every claim now matches what was measured.
Challenges
01Two censuses that count different people
- The challenge
- Singapore's census counts residents; Johor Bahru's counts everyone. A naive comparison could be attacked as unfair.
- How we solved it
- The page states the difference and bounds it. Even if none of Singapore's 1.64 million non-residents had all six essentials, Singapore would still be at least 57.1%, far above 12.0%. The direction of the finding cannot flip.
02A map that is thinner in one city
- The challenge
- OpenStreetMap under-records clinics in Johor Bahru, so part of the gap could be the map, not the city.
- How we solved it
- The whole analysis re-runs on Overture Places. Johor Bahru rises to 23.0% and the gap narrows by only two points, so most of it is real.
03Real data broke the sample's assumptions
- The challenge
- Moving from a development sample to the complete snapshot surfaced roads cut at the edge, a station layer with an empty name column and a border missing from the extract.
- How we solved it
- Each became a fix and a test: the border is drawn from boundary ways, the station audit counts every station, and cross-language tests make the browser reproduce the Python results.
04A heavy map on a light device
- The challenge
- The site leans on WebGL, and some readers and AI agents cannot run it.
- How we solved it
- Every page is prerendered, readable without JavaScript, keeps working when the map cannot start, and ships map stills for every story scene.
Impact
A self-initiated side project, so the impact is what it measured and made open rather than adoption. Every number below comes from the published data files.
- people routed on foot along mapped streets in two countries
- 5.8M
- share who reach all six essentials within 15 minutes, Singapore against Johor Bahru
- 80.4% vs 12.0%
- sensitivity runs; Singapore leads in every one
- 72
- Johor Bahru residents who would gain an essential from one 75 m footpath
- 2,200
- for the full accessibility stage across both cities
- ~75 s
- servers or API keys: the site does its maths in the browser
- 0
Lessons learned
- 01
Say what you measured, not what you meant
"Can I get an affordable meal?" became "Can I reach an eatery?". Matching each claim to its measurement made the study harder to attack and easier to trust.
- 02
Plan for the critique early
The census and map-coverage caveats came late, after review. Building the bounds and the second dataset in from day one would have saved a round of rewrites.
- 03
A story before an instrument
The explorer came first, but readers needed a guided path before a control panel. Next time I would sketch the story's scenes before building the tool behind them.