


Simulation study, WebGL, 2026
Driverless Yishun
A simulation study that asks whether driverless shuttles could carry every bus ride inside Yishun, a mature Singapore town. It replays 163,745 real weekday rides through a pooled shuttle fleet and shows the answer on a live 3D map, a scrolling data story and a driving game.
- Role
- Solo: research, modelling, design and build, paired with Claude
- Timeline
- 5 days, October 2026. About 2 of them on data and direction
- Stack
- Python simulator, D3, three.js on WebGPU, Blender
The problem
Singapore is starting to run driverless shuttles inside housing towns. Punggol has 16 of them, and the next step is point to point service across the whole estate with no fixed routes. I could not find anyone asking what that would take in an older, denser town where the bus network already works well.
The question I set: could on-demand autonomous shuttles carry every bus ride that starts and ends inside Yishun, and what would it cost in vehicles, kilometres and kerb space at the MRT? The answer had to be something a non-specialist could see, not just read in a table.
Research
The project began from a ChatGPT brief that proposed a traffic microsimulation of 0 to 80% private driverless cars. Before writing any model I checked that brief against primary sources, and it did not survive. The evidence pointed somewhere better, so I wrote a decision record, scored six alternative directions, and changed the question.
Singapore's driverless cars are fleets, not private cars
Car ownership is capped by the vehicle quota, and every public AV in the country is a shuttle serving a town. A private car penetration study would answer a question nobody here is asking.
The brief's model would echo its own guesses
Car following models mostly return the headways you feed them, and junction counts for calibration are sparse one-day surveys. The results would have been my assumptions in disguise.
The real data was better than the brief knew
LTA's fare-card data gives observed rides between every pair of stops by hour, and the live bus feed allows a real calibration of road speed, signal delay and dwell time.
Theory predicted a high price
Feeder studies find on-demand service beats fixed routes only at very low demand. Yishun's morning rush runs about 2,000 riders per square mile per hour, far above that, so the honest answer was likely to be expensive.
Design process
I treated the work as a study first and an interface second. Every number on the page comes from one pipeline, so the design could only be as good as the model under it. Claude was my pair: I set the question, the checks and the direction, and reviewed every result before it reached the page.
- 01
Collect and calibrate
About two days on data: three months of fare-card trips, bus routes and headways, and 171,838 live arrival estimates collected on one morning to fit road speeds, signal delay and bus dwell.
- 02
Simulate
An event-driven, pooled shuttle simulator replays every ride, against a model of today's buses on the same roads. Fleet size and seat count are swept over three simulated weekdays.
- 03
Attack the model
Three adversarial review rounds, a GPS check against observed bus movement, and 18 sensitivity cases that each change one assumption in both directions.
- 04
Make it visible
A 3D Yishun built from HDB storey counts, where you scrub a weekday and watch the simulated fleet move, then a scrolling story that walks through each finding.
Iterations
How Driverless Yishun changed on the way to what shipped, step by step.
v115 Oct
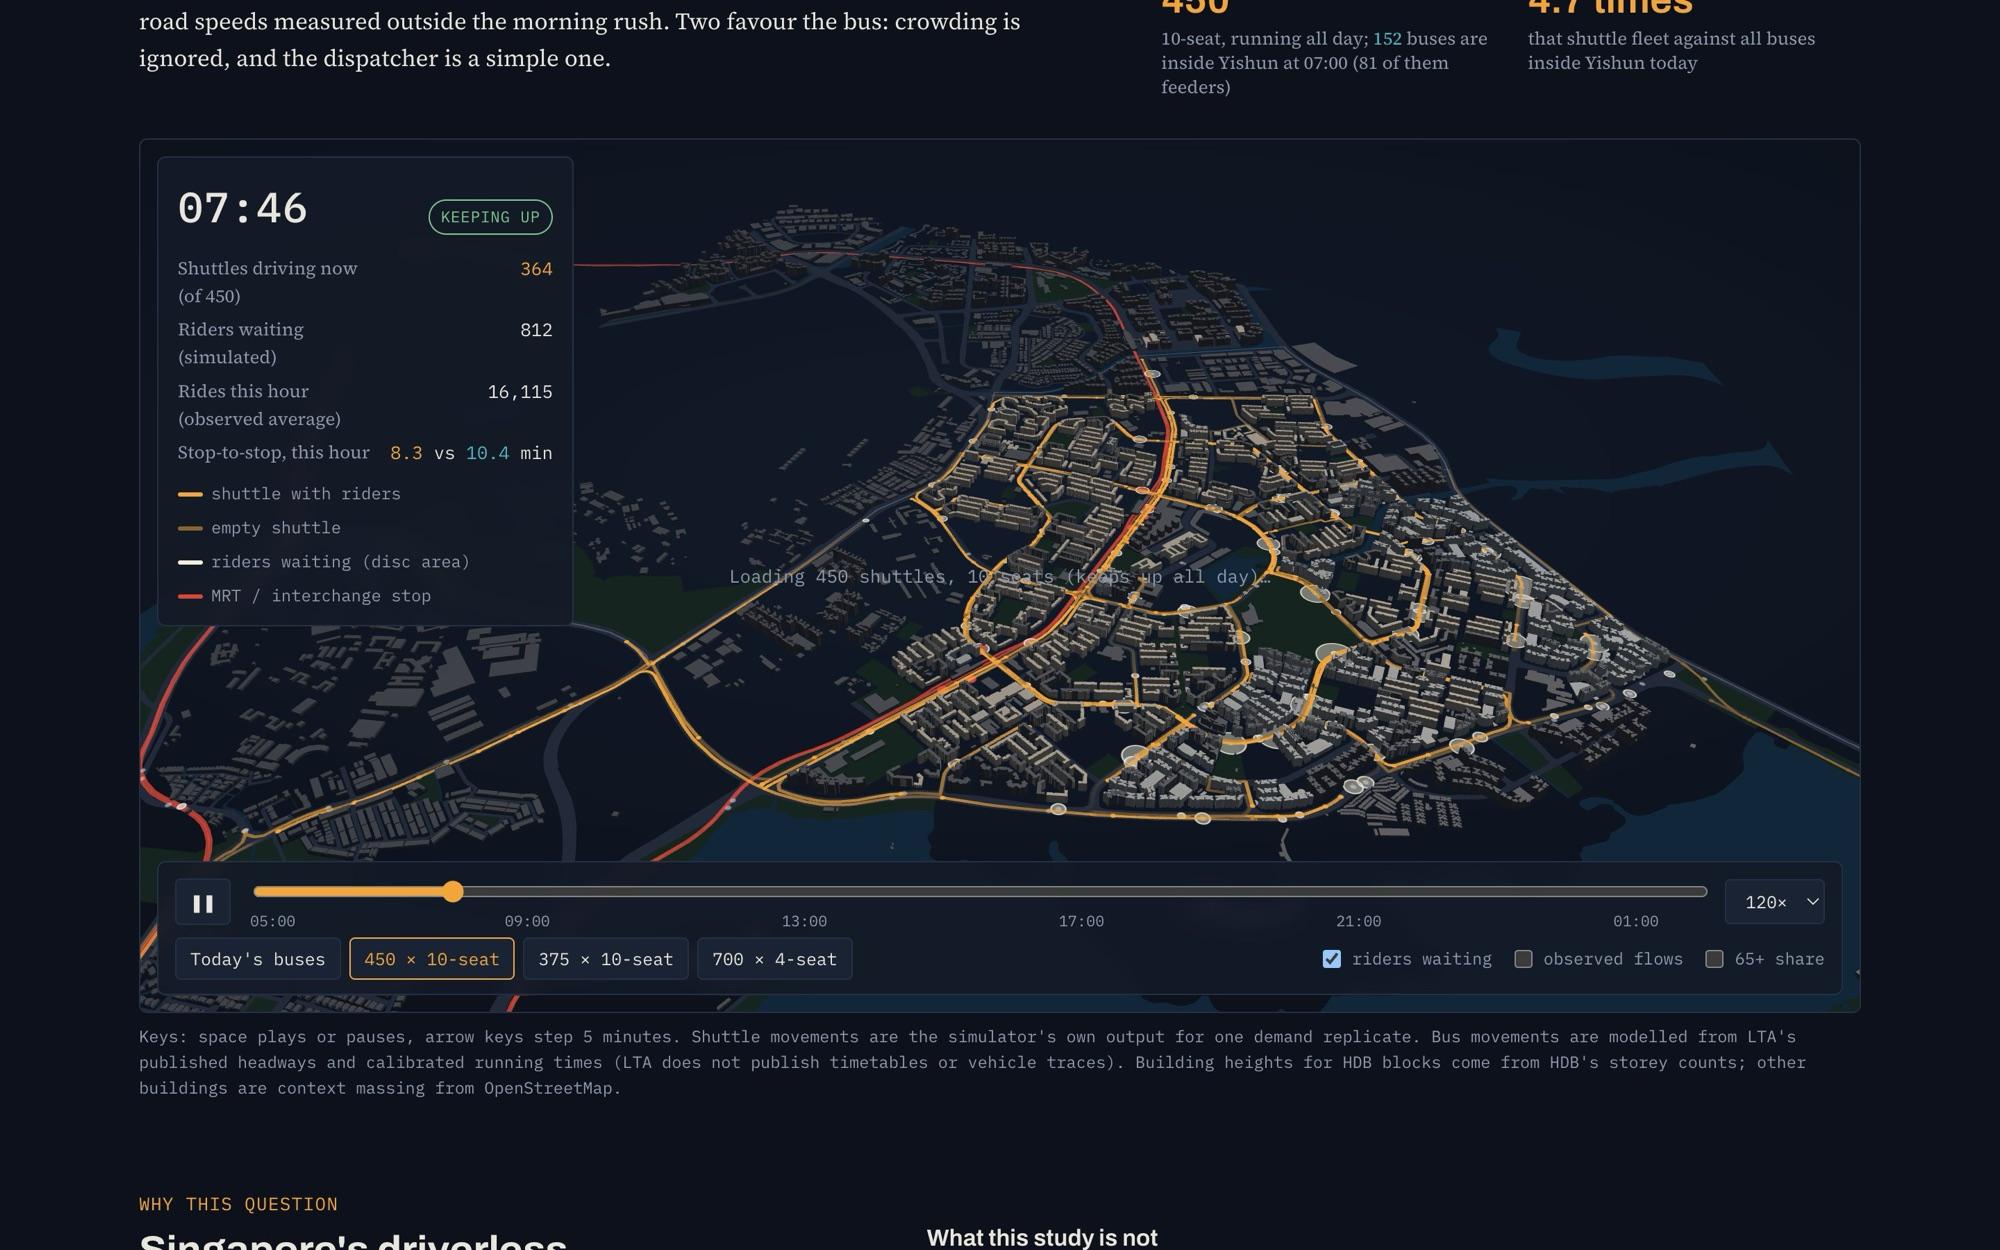
The first map
The first build with real data: Yishun in 3D with real block heights, a scrubbable weekday and a switch between the fleets that were actually simulated.
v115 Oct
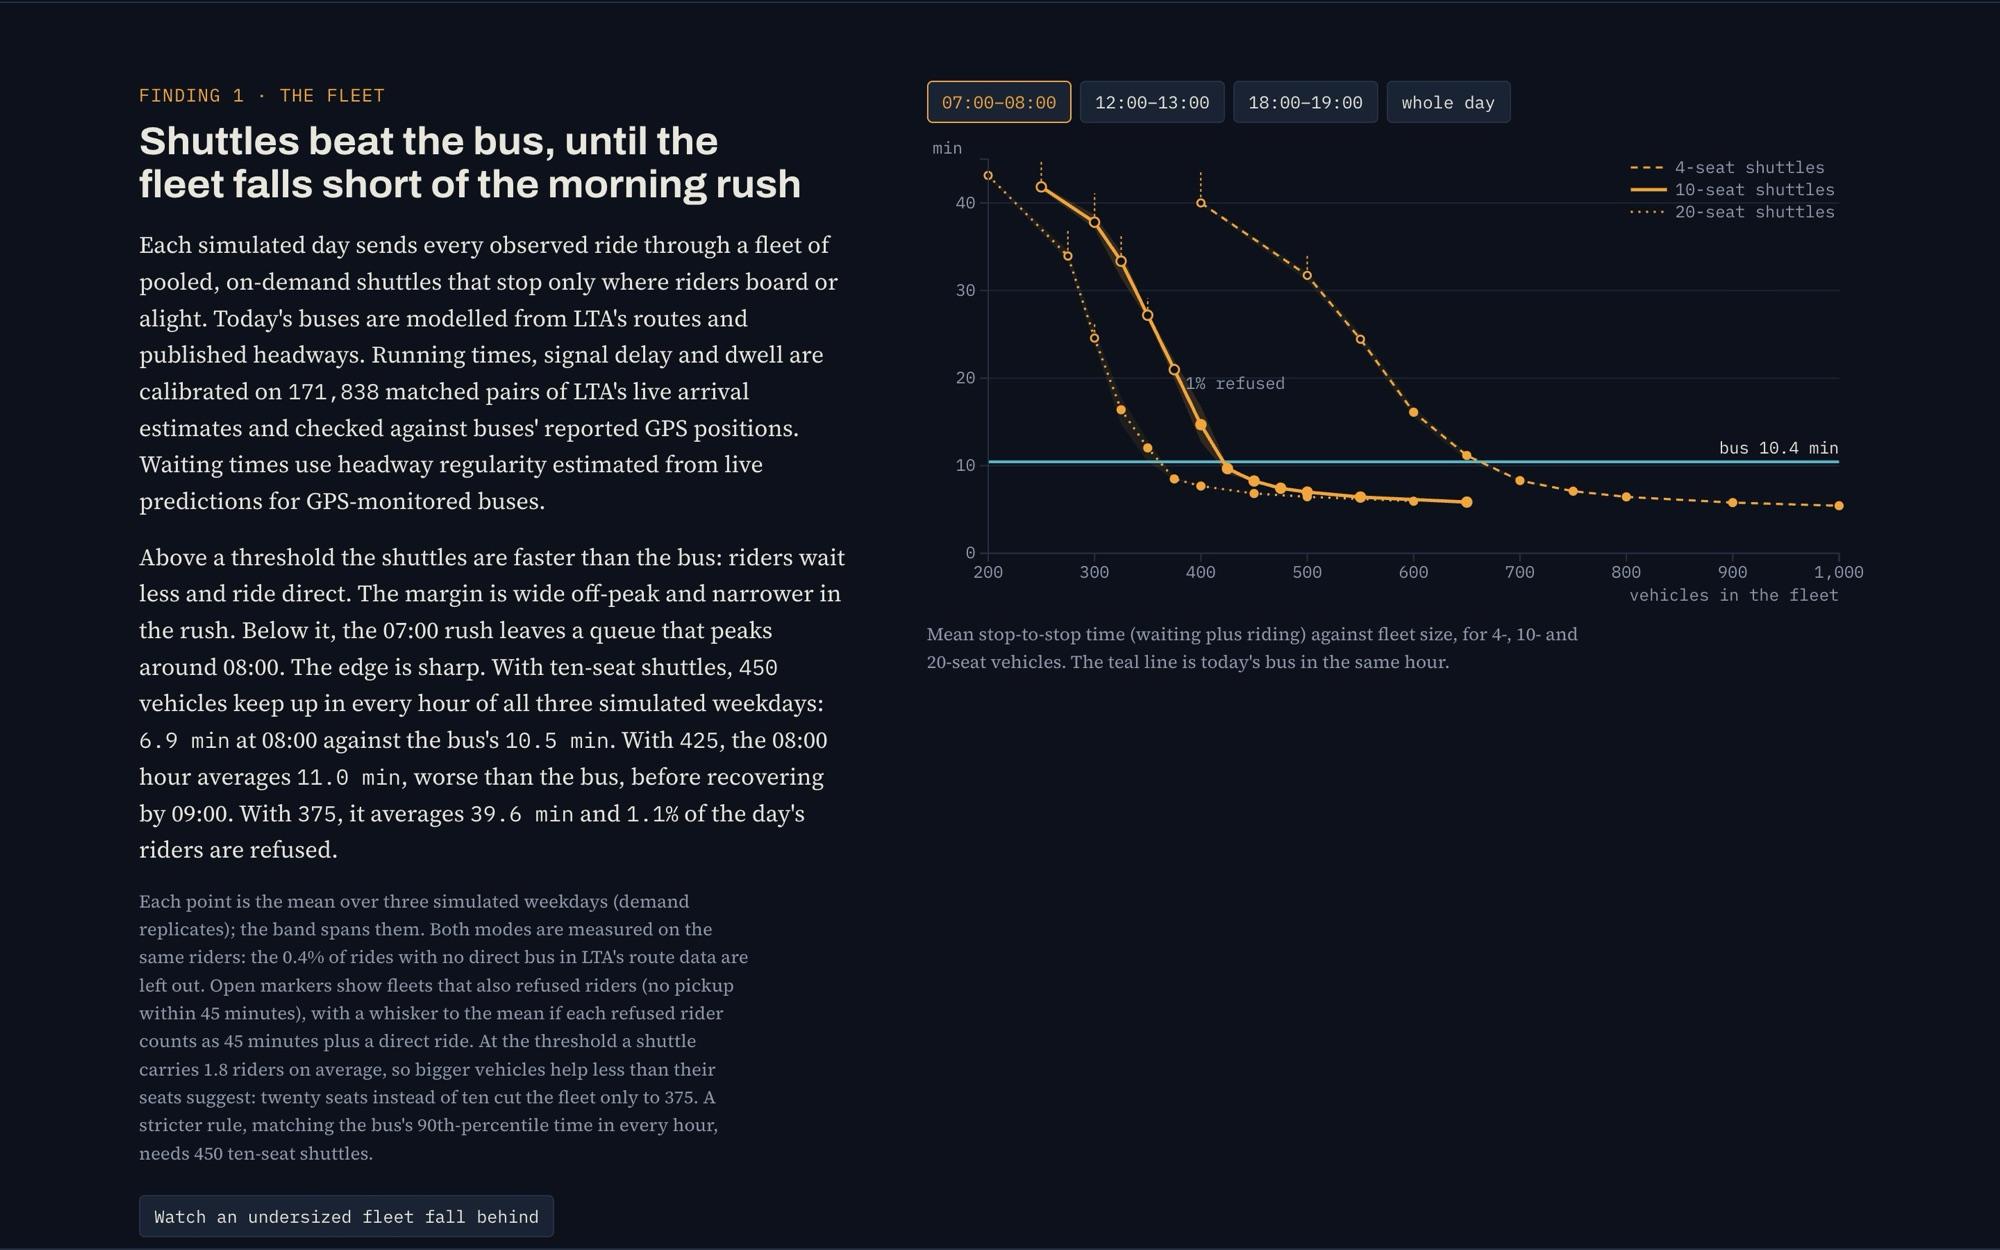
Findings as a long report
The fleet finding sat in a dense column of text beside a chart. Accurate, but the key moment, where 425 shuttles fail and 450 keep up, was buried.
v318 Oct
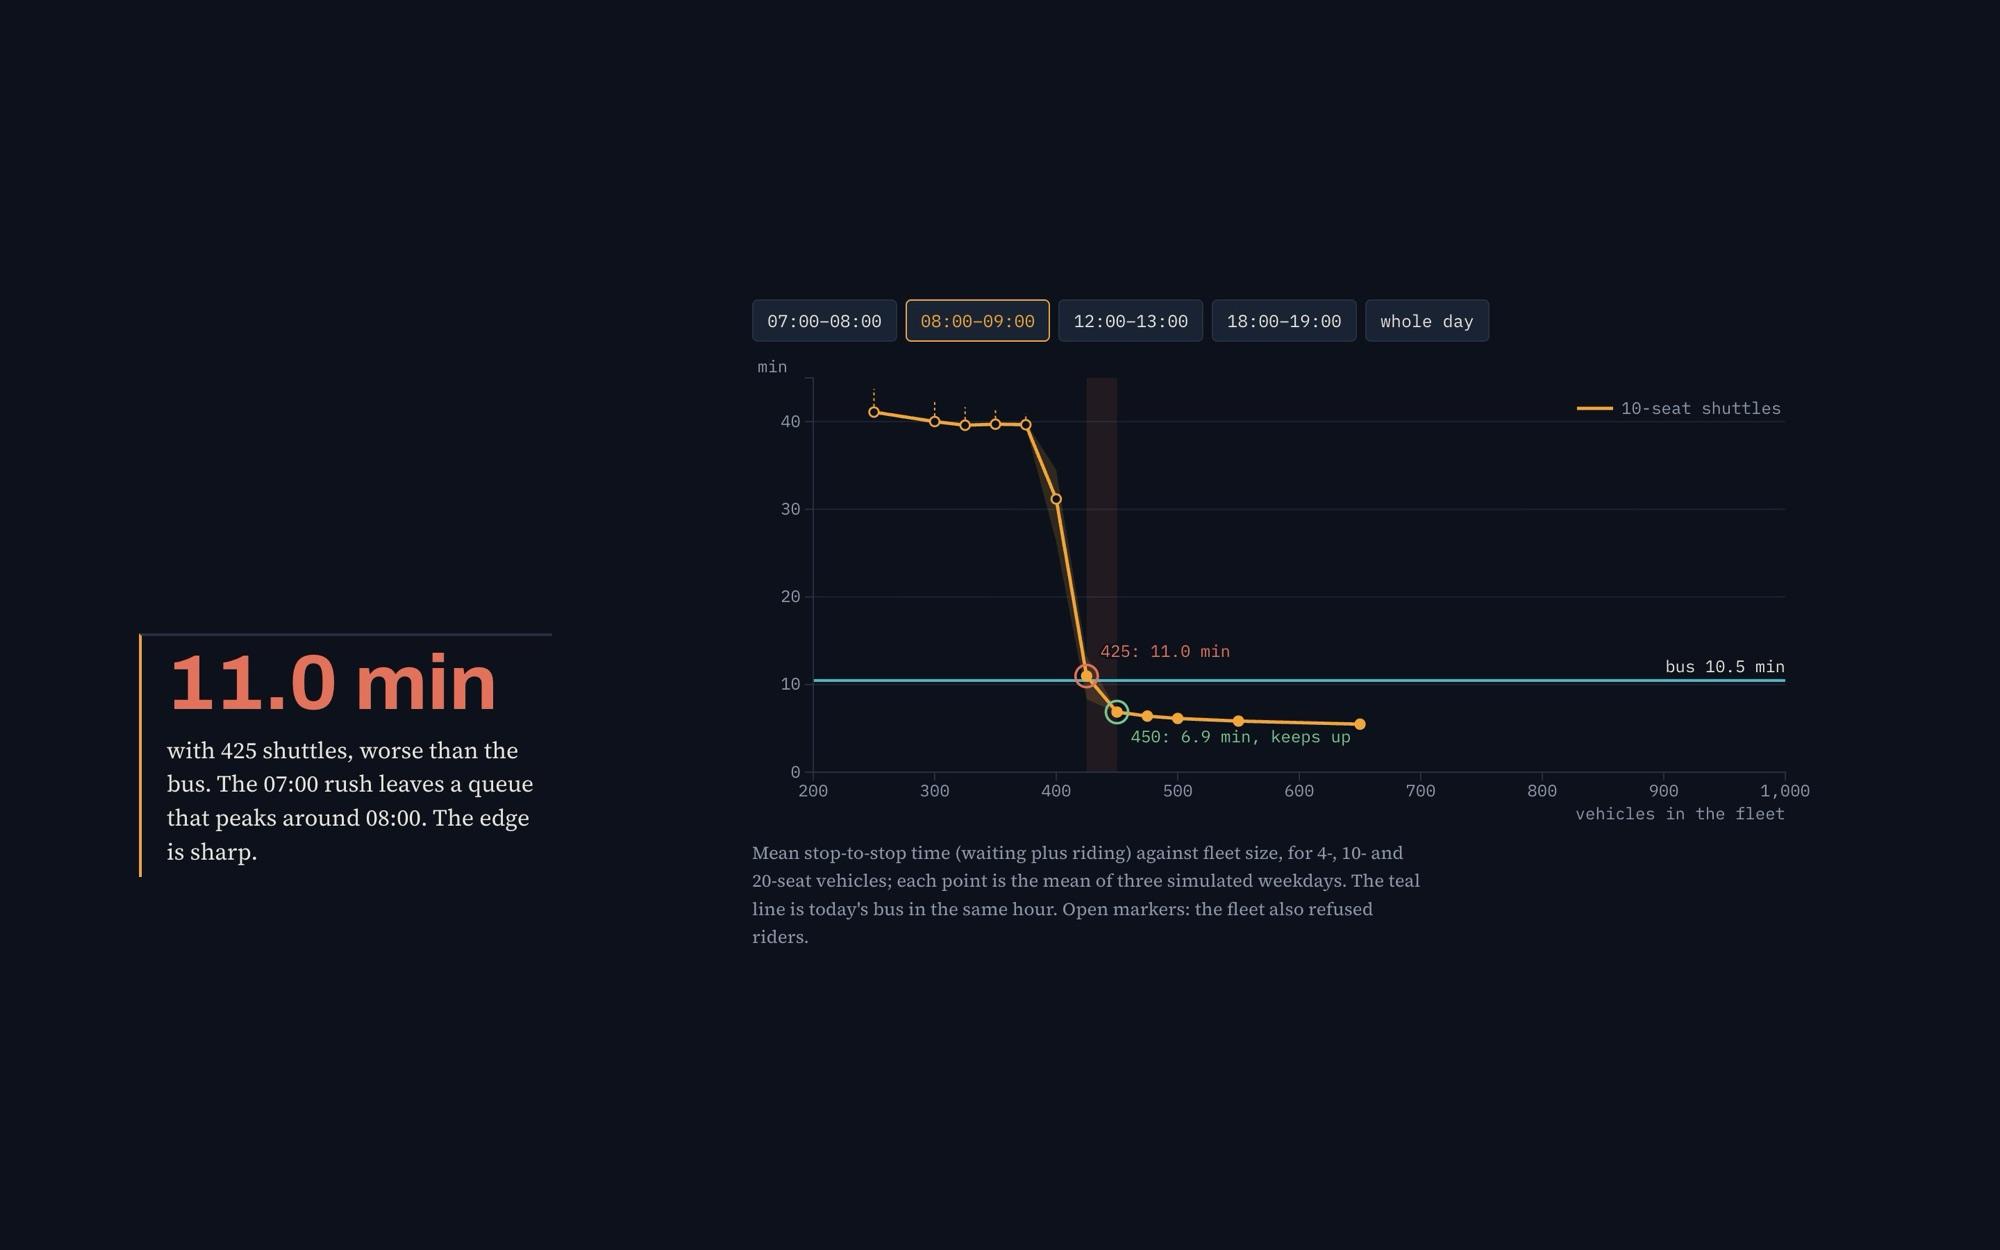
A scroll-driven story
Each finding became one big number and one chart that changes as you scroll. The capacity cliff now reads at a glance: 11.0 minutes with 425 shuttles, 6.9 with 450.
v419 Oct
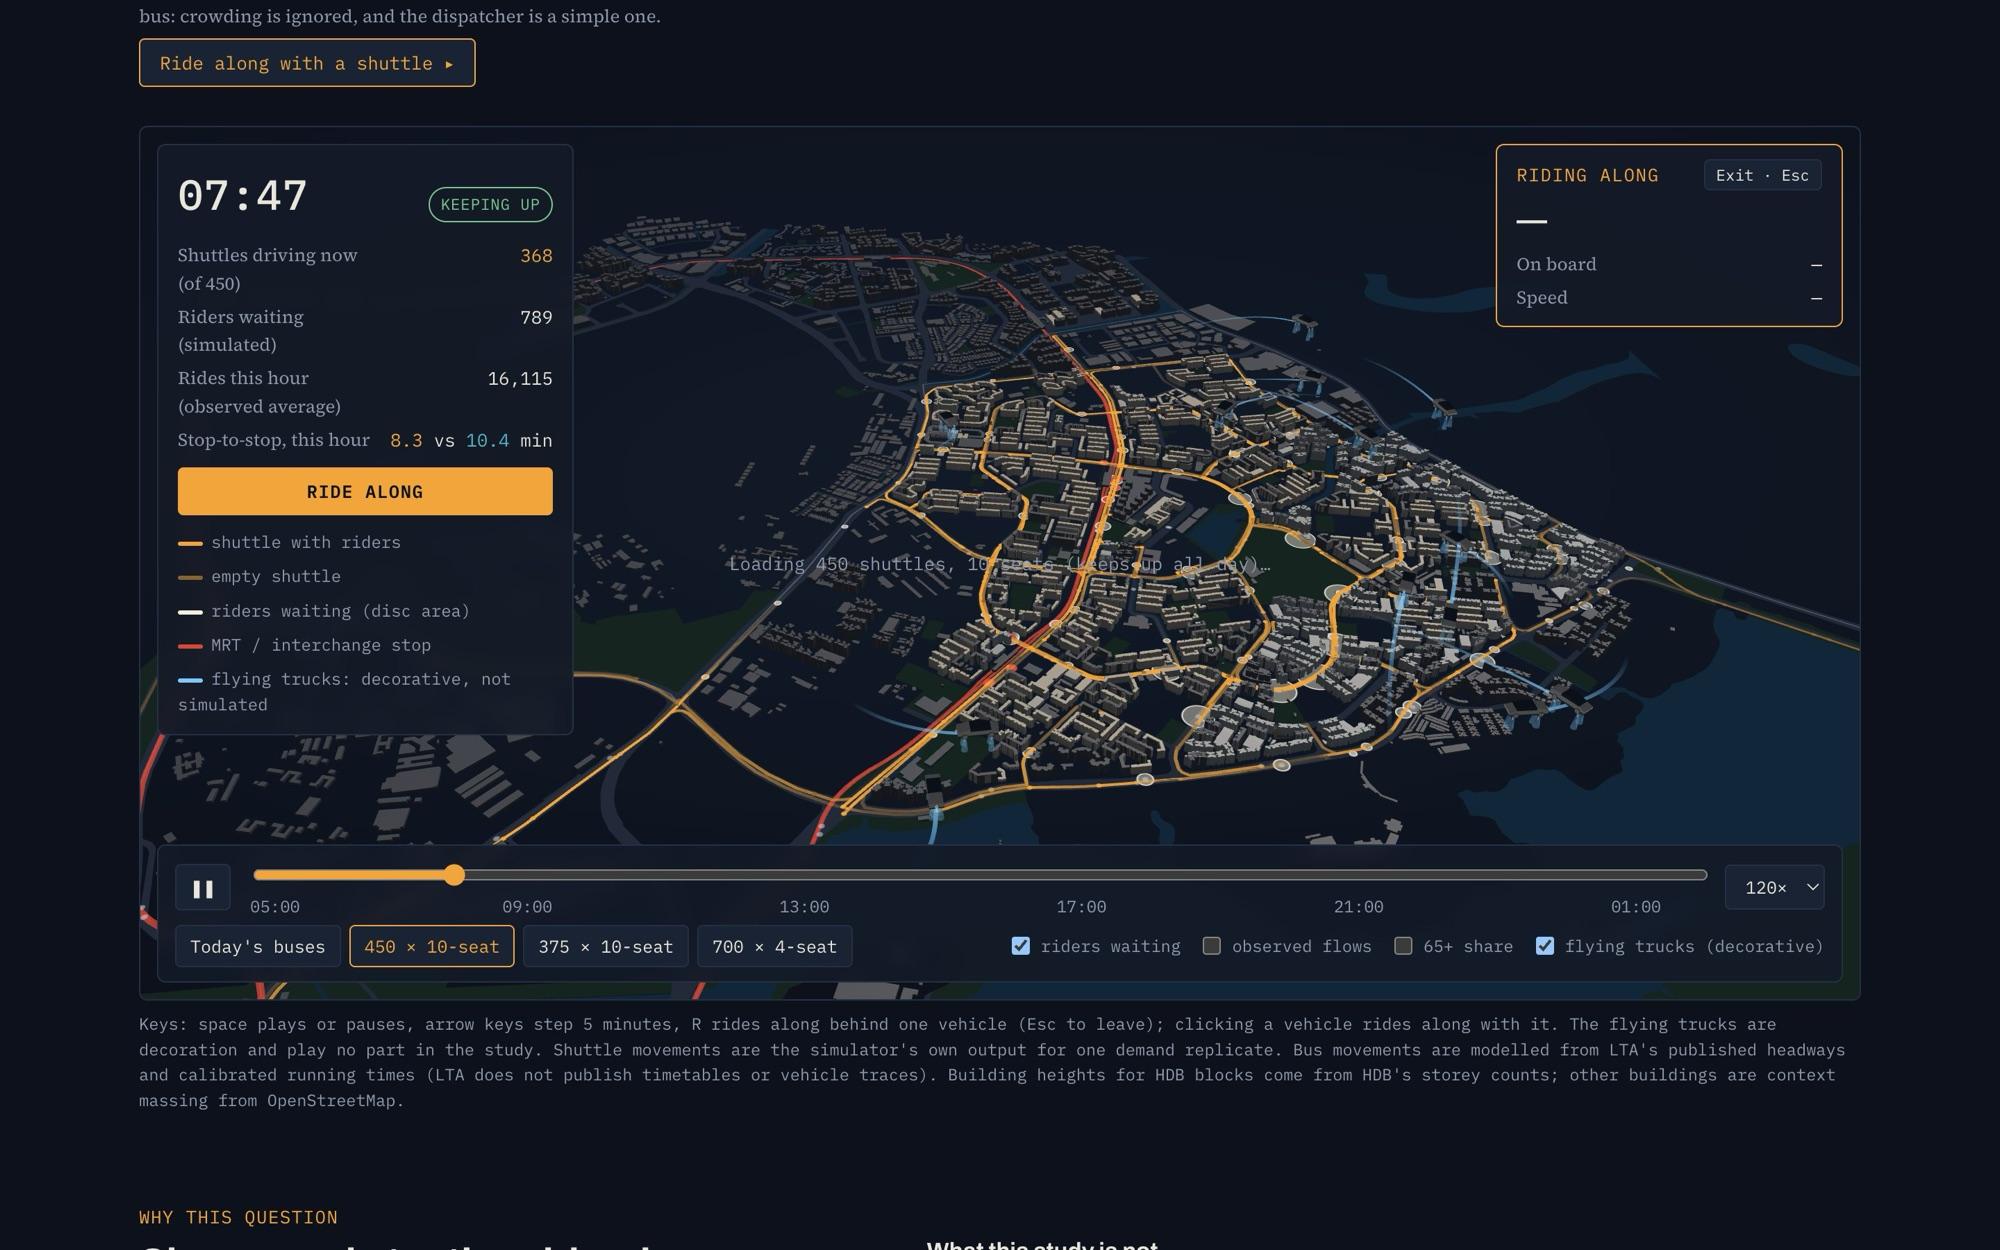
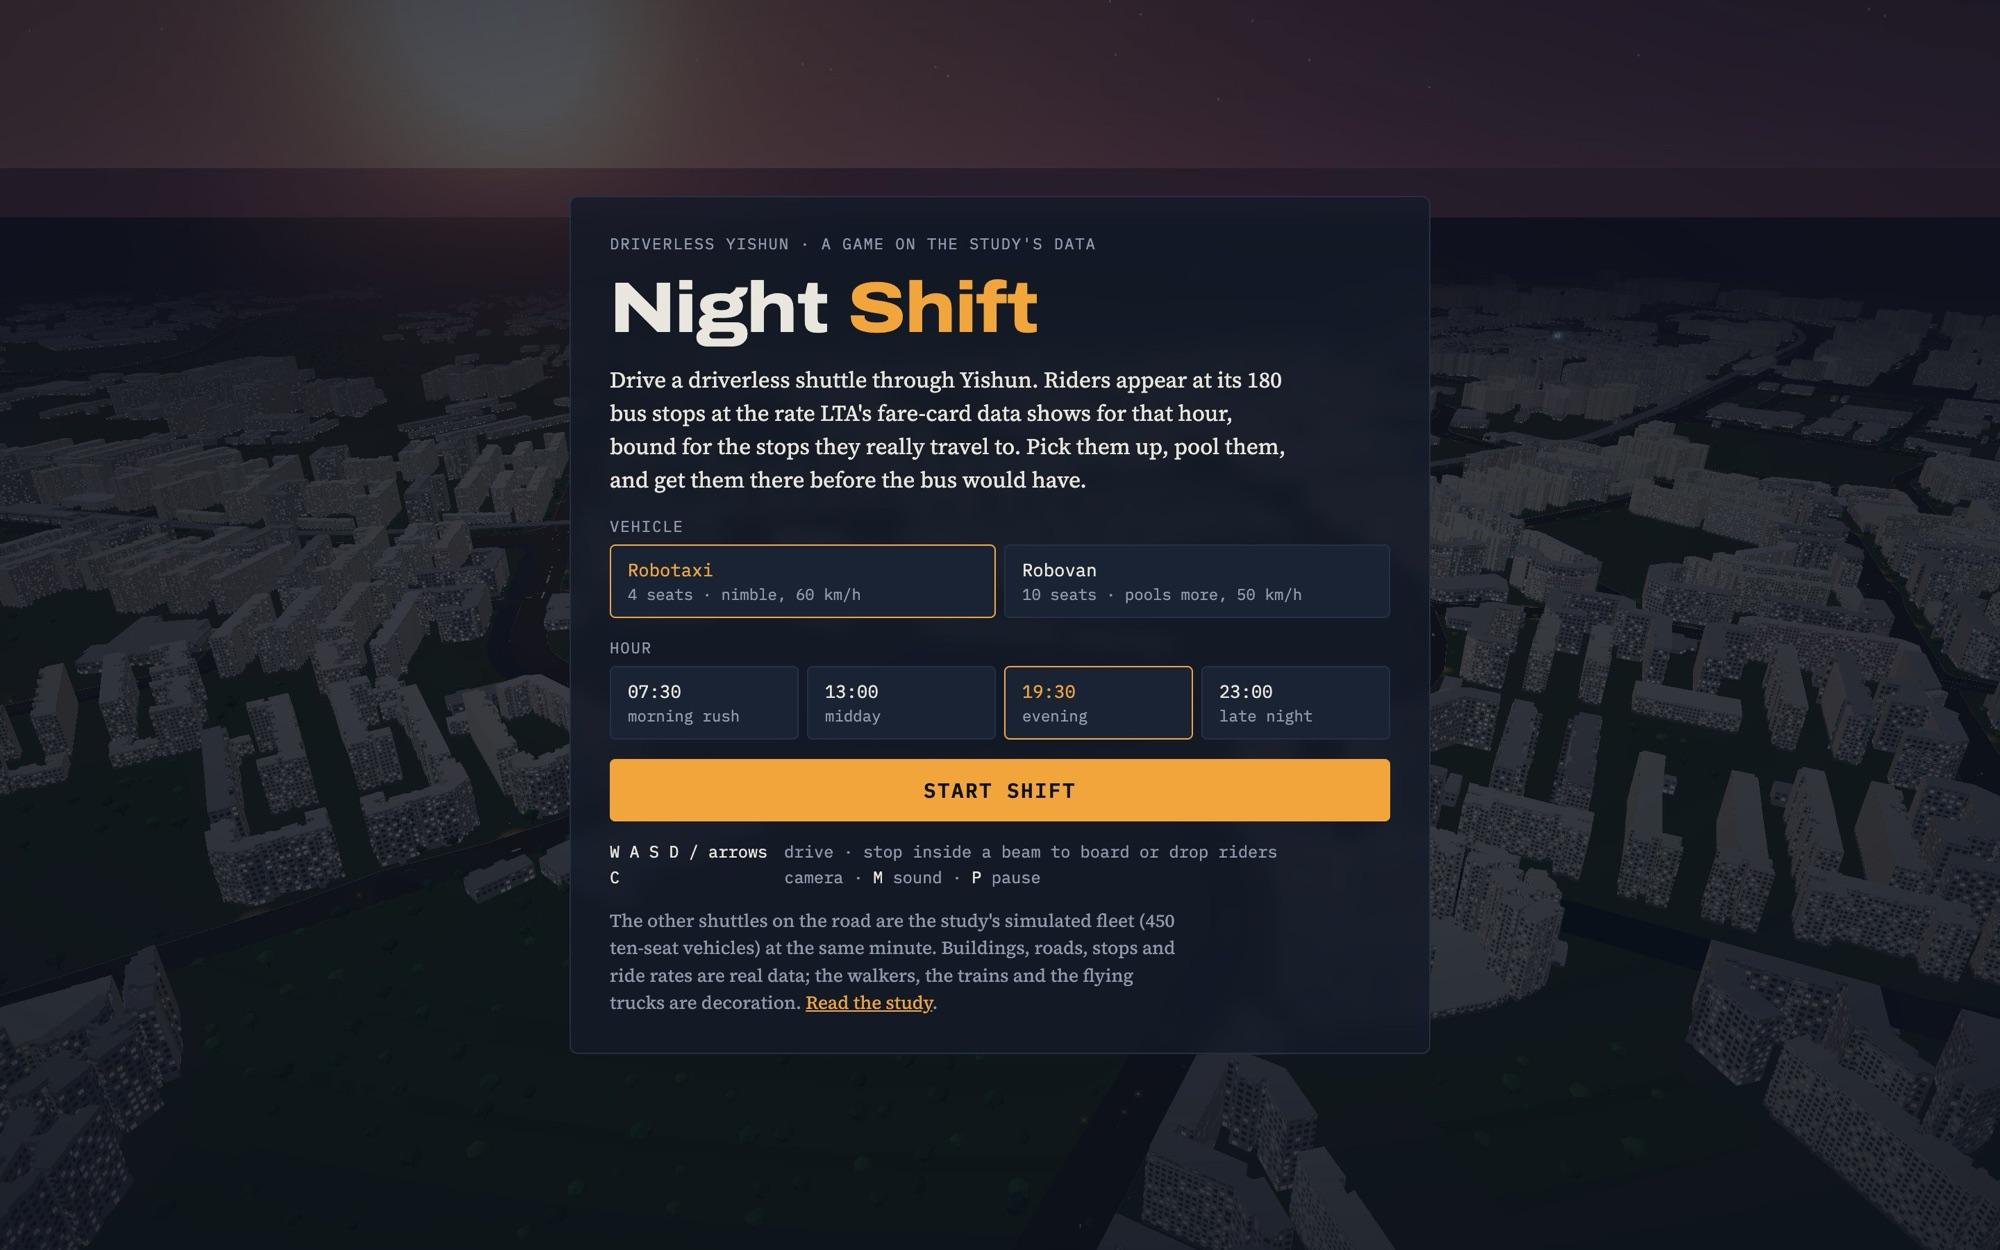
Ride along
Vehicles became Blender models, and you can now ride behind any one of them or fly the camera with WASD. The study stopped being a chart about a fleet and became a fleet you can follow.
v519 Oct
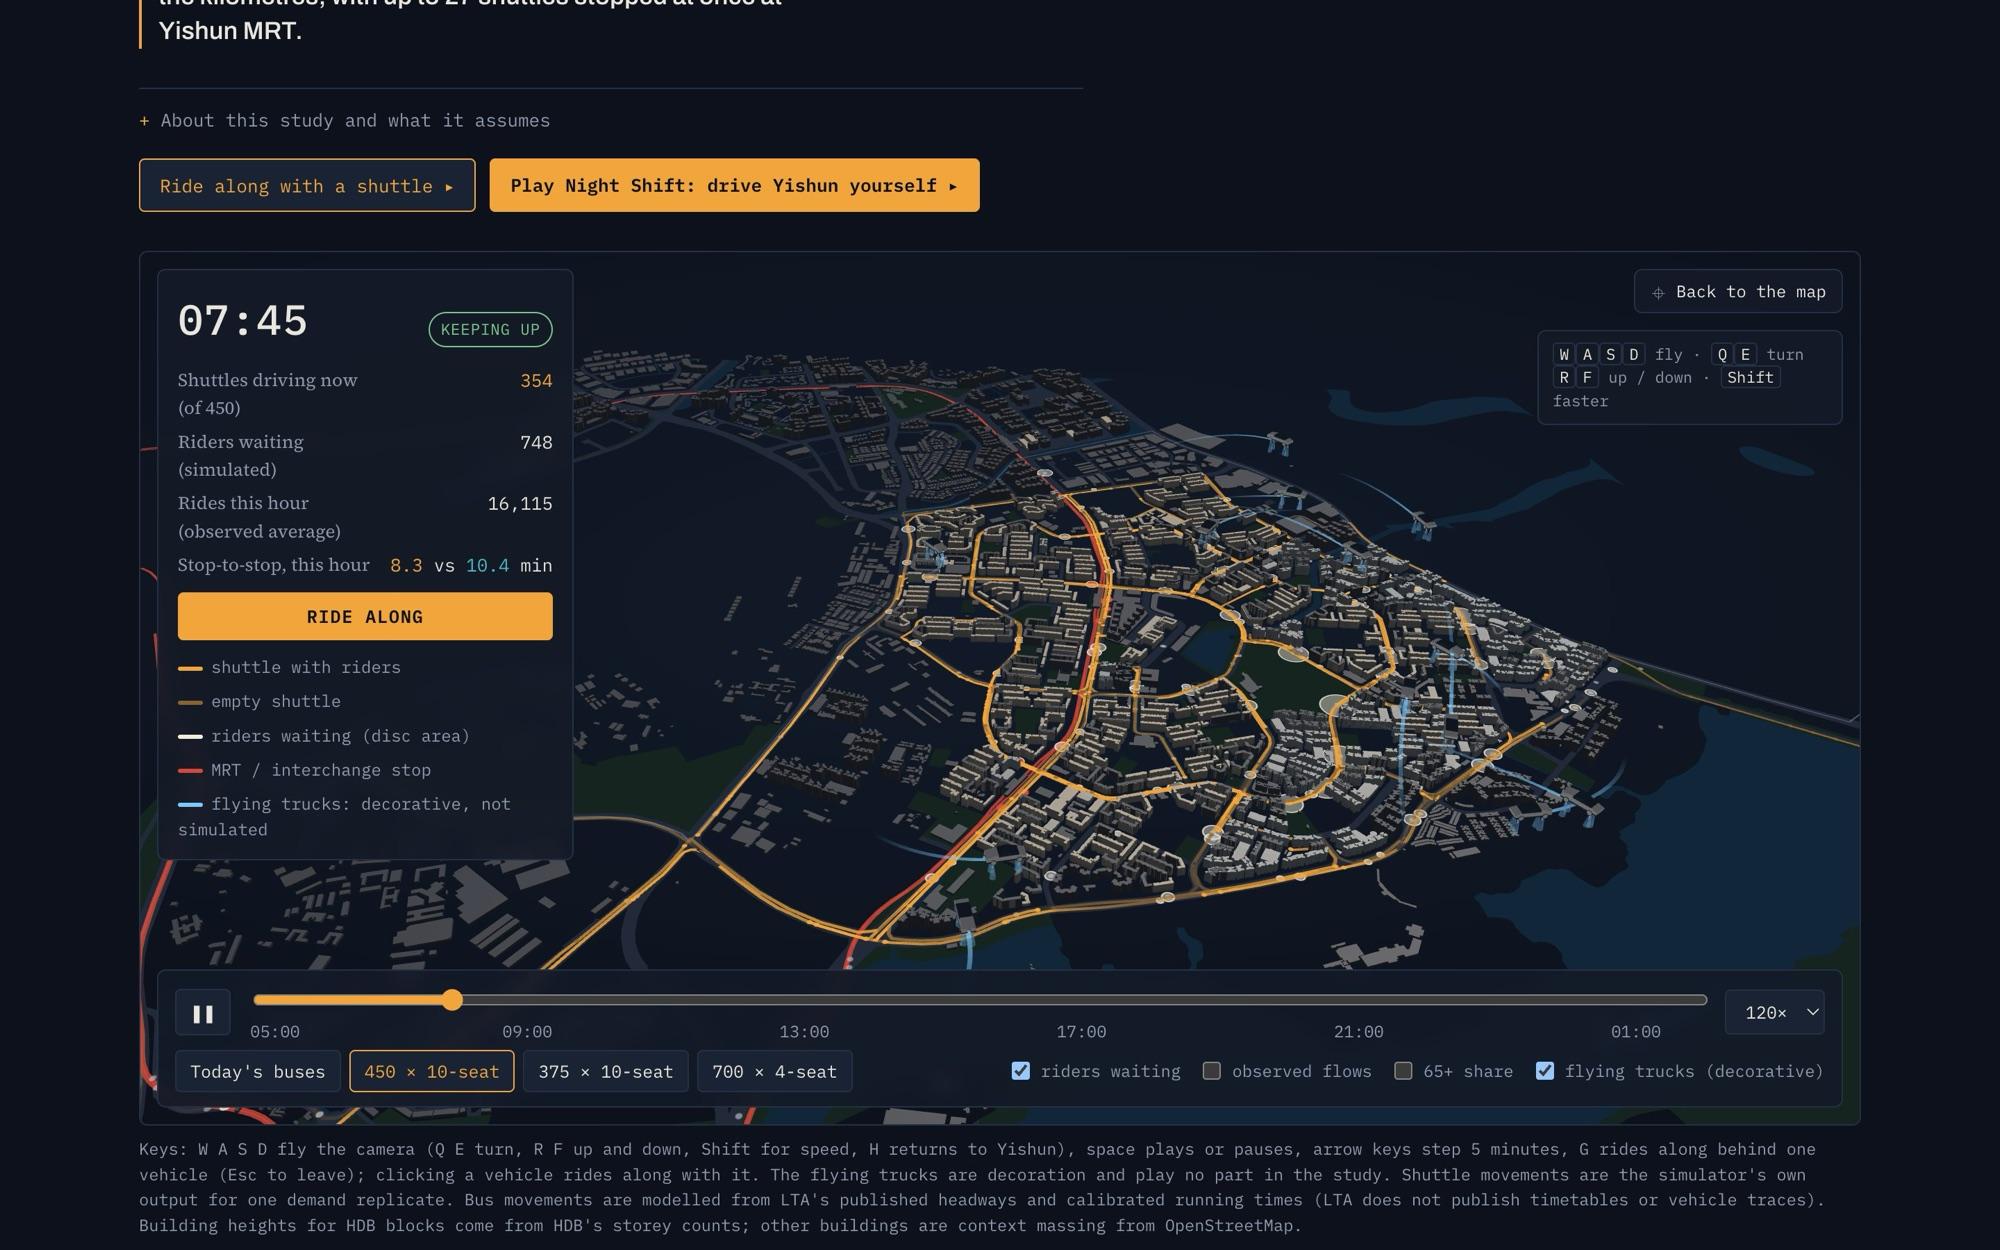
Night Shift
A street level driving game on the study's own data. Riders appear at Yishun's 180 stops at the rate the fare cards show, and the other shuttles on the road are the simulated fleet.
v619 Oct
The shipped map
The final explorer: a Back to the map control after flying away, keyboard help on screen, decorative flying trucks clearly labelled as not simulated, and links into the game.
Challenges
01Keeping the model honest
- The challenge
- A simulator can be tuned to say anything, and the first version had shortcuts, several of them in the shuttle's favour, such as riders requesting trips before the first bus of the day.
- How we solved it
- Three adversarial review rounds. Shuttles and buses are compared on the same riders, every assumption that helps the shuttle is listed on the page, and a sensitivity table shows the result moving between 375 and 550 vehicles.
02Road speeds nobody publishes
- The challenge
- LTA does not publish bus timetables or vehicle traces, so there was no ground truth for how fast a vehicle moves through Yishun.
- How we solved it
- I collected 171,838 live arrival estimates and fitted speed, signal delay and dwell to them. Holding out whole bus services, the error is 18% against 30% for a distance-only model, and observed GPS movement takes 0.99 times the modelled time.
03A sharp answer that is easy to miss
- The challenge
- The headline is a cliff: 450 shuttles keep up all day, 425 do not. In a table that difference looks like a rounding detail.
- How we solved it
- The scroll story stops on that exact edge, colours the failing fleet, and the map lets you watch an undersized fleet fall behind the morning rush in real time.
04A heavy 3D page on any device
- The challenge
- Hundreds of vehicles, a whole town of buildings and a WebGPU game had to survive old phones, blocked CDNs and lost graphics contexts.
- How we solved it
- Every failure ends in a message with a link to the study instead of a blank screen: a 30 second watchdog, retried data fetches, optional models with stand-in cars, and a pause and reload when the graphics context drops.
Impact
A self-initiated study, so the impact is what it measured and what it shipped rather than adoption. Every figure below is on the live page and reproducible from the repository.
- real weekday bus rides replayed, every one compared with today's bus
- 163,745
- ten-seat shuttles needed to beat the bus in every hour; 425 fall short
- 450
- the driving of today's buses inside Yishun, the cost the headline hides
- 4.7×
- road model error on held-out bus services, against 30% for distance alone
- 18%
- sensitivity cases, each changing one assumption in both directions
- 18
- from the first commit to a live study, explorer and game
- 5 days
Lessons learned
- 01
Test the brief before building it
Checking the original brief against primary sources before writing code saved days of modelling a question that did not fit Singapore. The decision record became the backbone of the whole study.
- 02
Let the model be attacked
The adversarial reviews found shuttle-friendly shortcuts I would not have caught myself. Making them a step in the process, not a last pass, is what lets the page state its numbers plainly.
- 03
A finding needs a moment, not a table
The capacity cliff only landed once it had its own scroll stop and a map you can watch fail. Next time I would design the key moment first and build the report around it.